
- Title
-
Live cell-lineage tracing and machine learning reveal patterns of organ regeneration
- Authors
- Viader-Llargués, O., Lupperger, V., Pola-Morell, L., Marr, C., López-Schier, H.
- Source
- Full text @ Elife
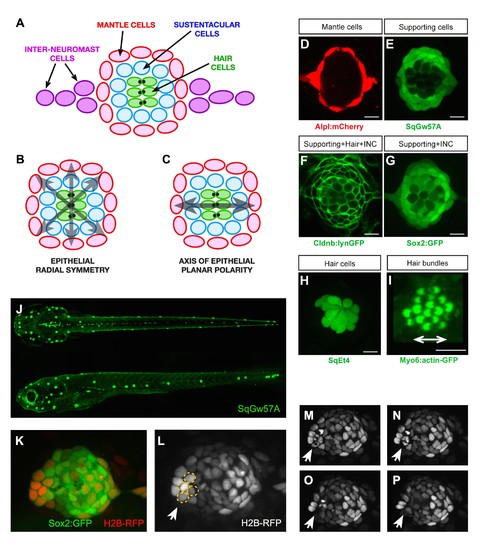
Geometric organization of the neuromast. (A–C) Schematic representation of a neuromast depicting (A) cell classes identifiable by expression of transgenic markers. Grey arrows indicate, respectively, (B) radial symmetry and (C) epithelial planar polarity. (D–I) Confocal images of cell-specific transgenic markers. (D) Alpl:mCherry marks mantle and interneuromast cells, (E) SqGw57A shows all supporting cells, (F) Cldnb:lynGFP marks all neuromast cells, (G) Sox2-GFP marks supporting and interneuromast cells, (H) SqET4 labels hair cells, and (I) Myo6b:actin-GFP highlights the planar polarization of the hair cells by decorating their apical stereocilia. Scale bars: 10 µm. (J) Images of dorsal (top) and lateral (bottom) views of a SqGw57A transgenic zebrafish larva, revealing the full complement of superficial neuromasts and their stereotypic position. (K) A single confocal section of the lateral view of a neuromast expressing GFP in supporting cells (Sox2-GFP) and a RFP in all nuclei (H2B-RFP). (L) Same neuromast in K showing RFP-marked nuclei. The white arrow indicates 4 cells (circled), which are target of the laser beam for ablation. (M–P) Four still images of the neuromast in L over a period of five minutes, in which the laser-targeted cells are eliminated from the epithelium (white arrow). |
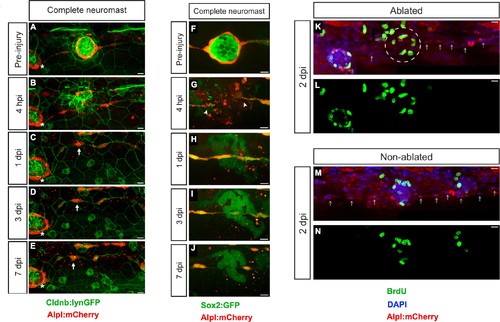
Zebrafish larvæ do not regenerate completely-ablated neuromasts. (A–E) Confocal images of a 7 day follow-up of the complete ablation of a neuromast in the double transgenic line Tg[Cldnb:lynGFP; Alpl:mCherry]. (A) The site of damage was identified over subsequent days by the position of an intact reference neuromast (white asterisk). (B) Laser-mediated cell ablation produced a wound 4 hours-post-injury (hpi). (C–E) This wound was replaced by a thread of mCherry(+) cells (white arrow) 1 day-post-injury (dpi), which did not change over the subsequent 6 days. (F–J) Confocal images over a 7 day time course after the ablation of a neuromast in the double transgenic line Tg[Sox2:GFP; Alpl:mCherry]. Identically to A-E, the complete ablation of the target neuromast results in a thin trail of interneuromast cells (white arrowheads) covering the damaged area (K–N). Scale bars: 10 µm. |
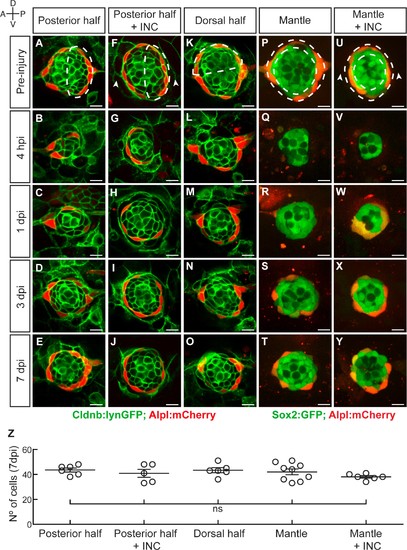
Neuromasts have isotropic regenerative capacity. (A) Ablation of the posterior half of a neuromast. (B–C) The damage is resolved by cellular movement from the undamaged site 1dpi. (D) Neuromasts recover geometric order after 3 days and (J) return to homeostasis by 7dpi. Dashed lines in A,F,K,P,U delineate the ablated area. (F–J) Simultaneous ablation of the posterior half of a neuromast and the interneuromast cells flanking its anterior and posterior sides (n = 5) led to a regeneration outcome identical to that of the experiment in (A–E). Arrowheads in (F) point the location normally occupied by the interneuromast cells. (K–O) Neuromasts depleted from their dorsal half (n = 6) also recover epithelial size, proportions and geometry in a manner indistinguishable from equatorial-side ablation after 7 days. (P–T) 7 days after their complete laser-mediated ablation, mantle cells regenerated for neuromasts to recover the mantle. (U–Y) The ablation of interneuromast cells flanking both sides of neuromasts that were depleted of mantle cells resulted in the same outcome (n = 6). (Z) Quantification of the number of cells in regenerated neuromasts at 7 dpi. Number of neuromast cells was no statistically significant between groups of different damage regimes as determined by one-way ANOVA (F(4,27)=1.013, p=0.4183). Scatter plot shows mean ±s.e.m.ns: non-significant. Scale bars: 10 µm. |
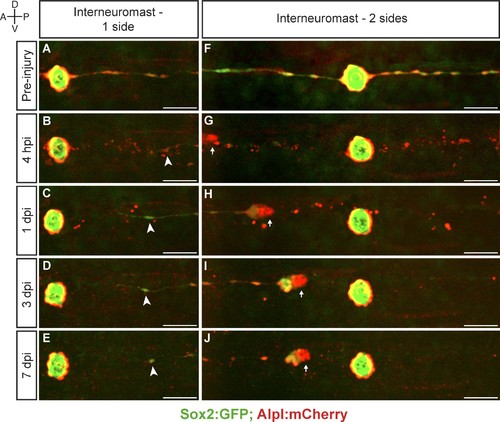
Interneuromast cells do not regenerate. (A–E) The ablation of interneuromast cells adjacent to one flank of a neuromast resulted in the stretching of the last undamaged interneuromast cell (arrowhead) but does not trigger interneuromast-cell proliferation or the reformation of interneuromast-cell strings (n = 14). (F–J) Likewise, the complete ablation of interneuromast cells in both flanks from one neuromast to the next, generates a corresponding gap of interneuromast cells that did not change over 7 days (n = 8). Scale bars: 50 µm. |
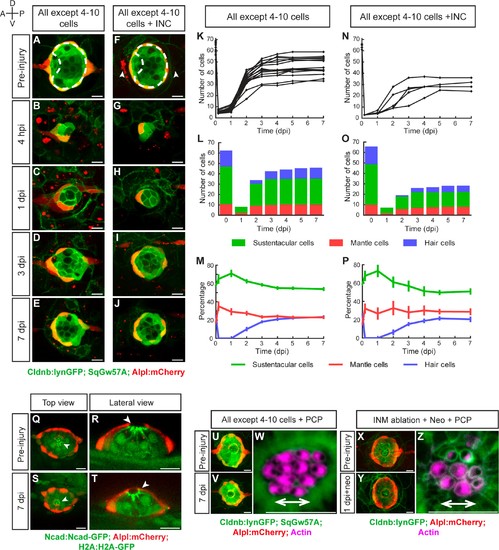
Recovery of organ architecture after loss of tissue integrity. (A–E) Confocal images of a neuromast regenerating from 4 to 10 cells during a period of 7 days. Neuromasts recover radial symmetry 3 dpi (D), and original organ proportions at 7 dpi (E). (F–J) Neuromasts reduced to 4–10 cells that were previously deprived from adjacent interneuromast cells (INCs) (arrowheads in F), regenerated and reformed radial symmetry (H–I) and proportions 7 dpi, despite maintaining a reduced size (J). Dashed circles in (A,F) illustrate damaged areas. Scale bars: 10 µm. (K,N) Total cell numbers in regenerating neuromasts over 7 days in the two conditions depicted in (A–J). (L,O) In the first 2 dpi neuromast consist almost exclusively of supporting cells (green and red). Hair cells (blue) begin to appear between at 2dpi. (M,P) Percentages of cell classes during a 7 day regeneration period. Right after damage, neuromast experience an imbalance of cell proportions that is re-established over the course of 3 days. Afterwards the neuromasts continues to slowly increase total cell number at similar rates. The final proportion of cell classes recapitulates that of the starting condition. Time points show mean ± s.e.m. [All except 4–10 cells] n = 15, [All except 4–10 cells + INC] n = 6. (Q) Top and (R) lateral views of a triple-transgenic Tg[Ncad: Ncad-EGFP; Alp:mCherry; H2A:H2A-EGFP] neuromast before injury. (S) Top and (T) lateral views of a regenerated neuromast 7 days post injury (n = 4). Basal location of nuclei and apical N-cadherin enrichment evidence the apicobasal polarization of the organ. The accumulation of N-cadherin (white arrowheads) in the regenerated neuromast shows that apical constrictions are properly re-established during the process. (U–V) Maximal intensity projection of a neuromast in the triple transgenic line Tg[Cldnb:lynGFP; SqGw57A; Alpl:mCherry] prior to injury that eliminates all except 4 to 10 cells (U), and the same neuromast 7 days after damage (V). (W) Hair-bundle staining with rhodamine-phalloidin (colored in pink) reveals the coherent planar polarization of the hair cells in the regenerated neuromast shown in (V). (X) Confocal projection of a neuromast before the removal of flanking interneuromast cells. (Y) Maximal projection of a neuromast 48 hr after interneuromast-cell ablation and 24 hr after neomycin treatment. (Z) Phalloidin staining of hair bundles of hair cells regenerated in the absence of interneuromast cells, showing recovery of coherent epithelial planar polarity. Scale bars: 10 µm. |
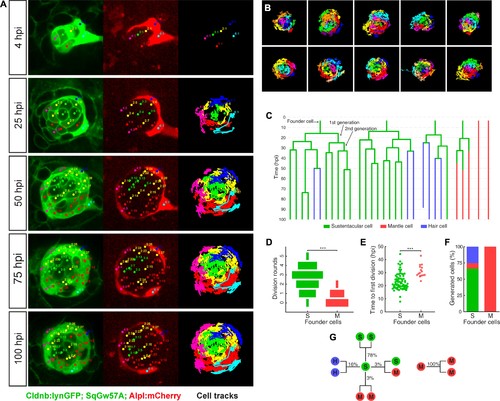
Long-term whole-organ single-cell tracking reveals cell-clone formation during neuromast regeneration. (A) Still images showing a representative 100 hr time-lapse recording of a regenerating neuromast in Tg[Clndb:lynGFP; SqGw57A; Alpl:mCherry] larva (left and middle panels). Cellular clones that share a common founder cell are clustered and color-coded. Cell trajectories reveal a concentric growth pattern (right panel). (B) Cell trackings at the last recorded timepoints for 10 out of the total of 15 regenerated neuromasts. (C) Cell-lineage tracing from time-lapse movie shown in (A). Branching points symbolize cell divisions. The division of a founder cell generates two cells of the 1 st generation. Subsequent divisions produce cells of the 2nd, 3rd and 4th generation. Cell classes are indicated with green (sustentacular), blue (hair) and red (mantle) colors. (D) Sustentacular founder cells undergo significantly more (p=3.59e-06, Mann-Whitney test) division rounds than mantle founder cells during 100 hr of neuromast regeneration. (E) The first division of sustentacular founder cells (n = 76) occurs significantly earlier (p=1.13e-5, Mann-Whitney test) than that of mantle founder cells (n = 16). (F) Sustentacular founder cells (n = 76) generate all three neuromast cell classes whereas mantle founder cells (n = 30) produce only mantle cells. (G) Out of 307 sustentacular cell divisions, 78% were self-renewing, 16% produced a pair of hair cells, 3% produced sustentacular cells that both became mantle cells within the next generation and 3% generated two sustentacular cells of which only one transited to mantle cell fate within the next generation. All 20 observed mantle cell divisions were self-renewing. |