
|
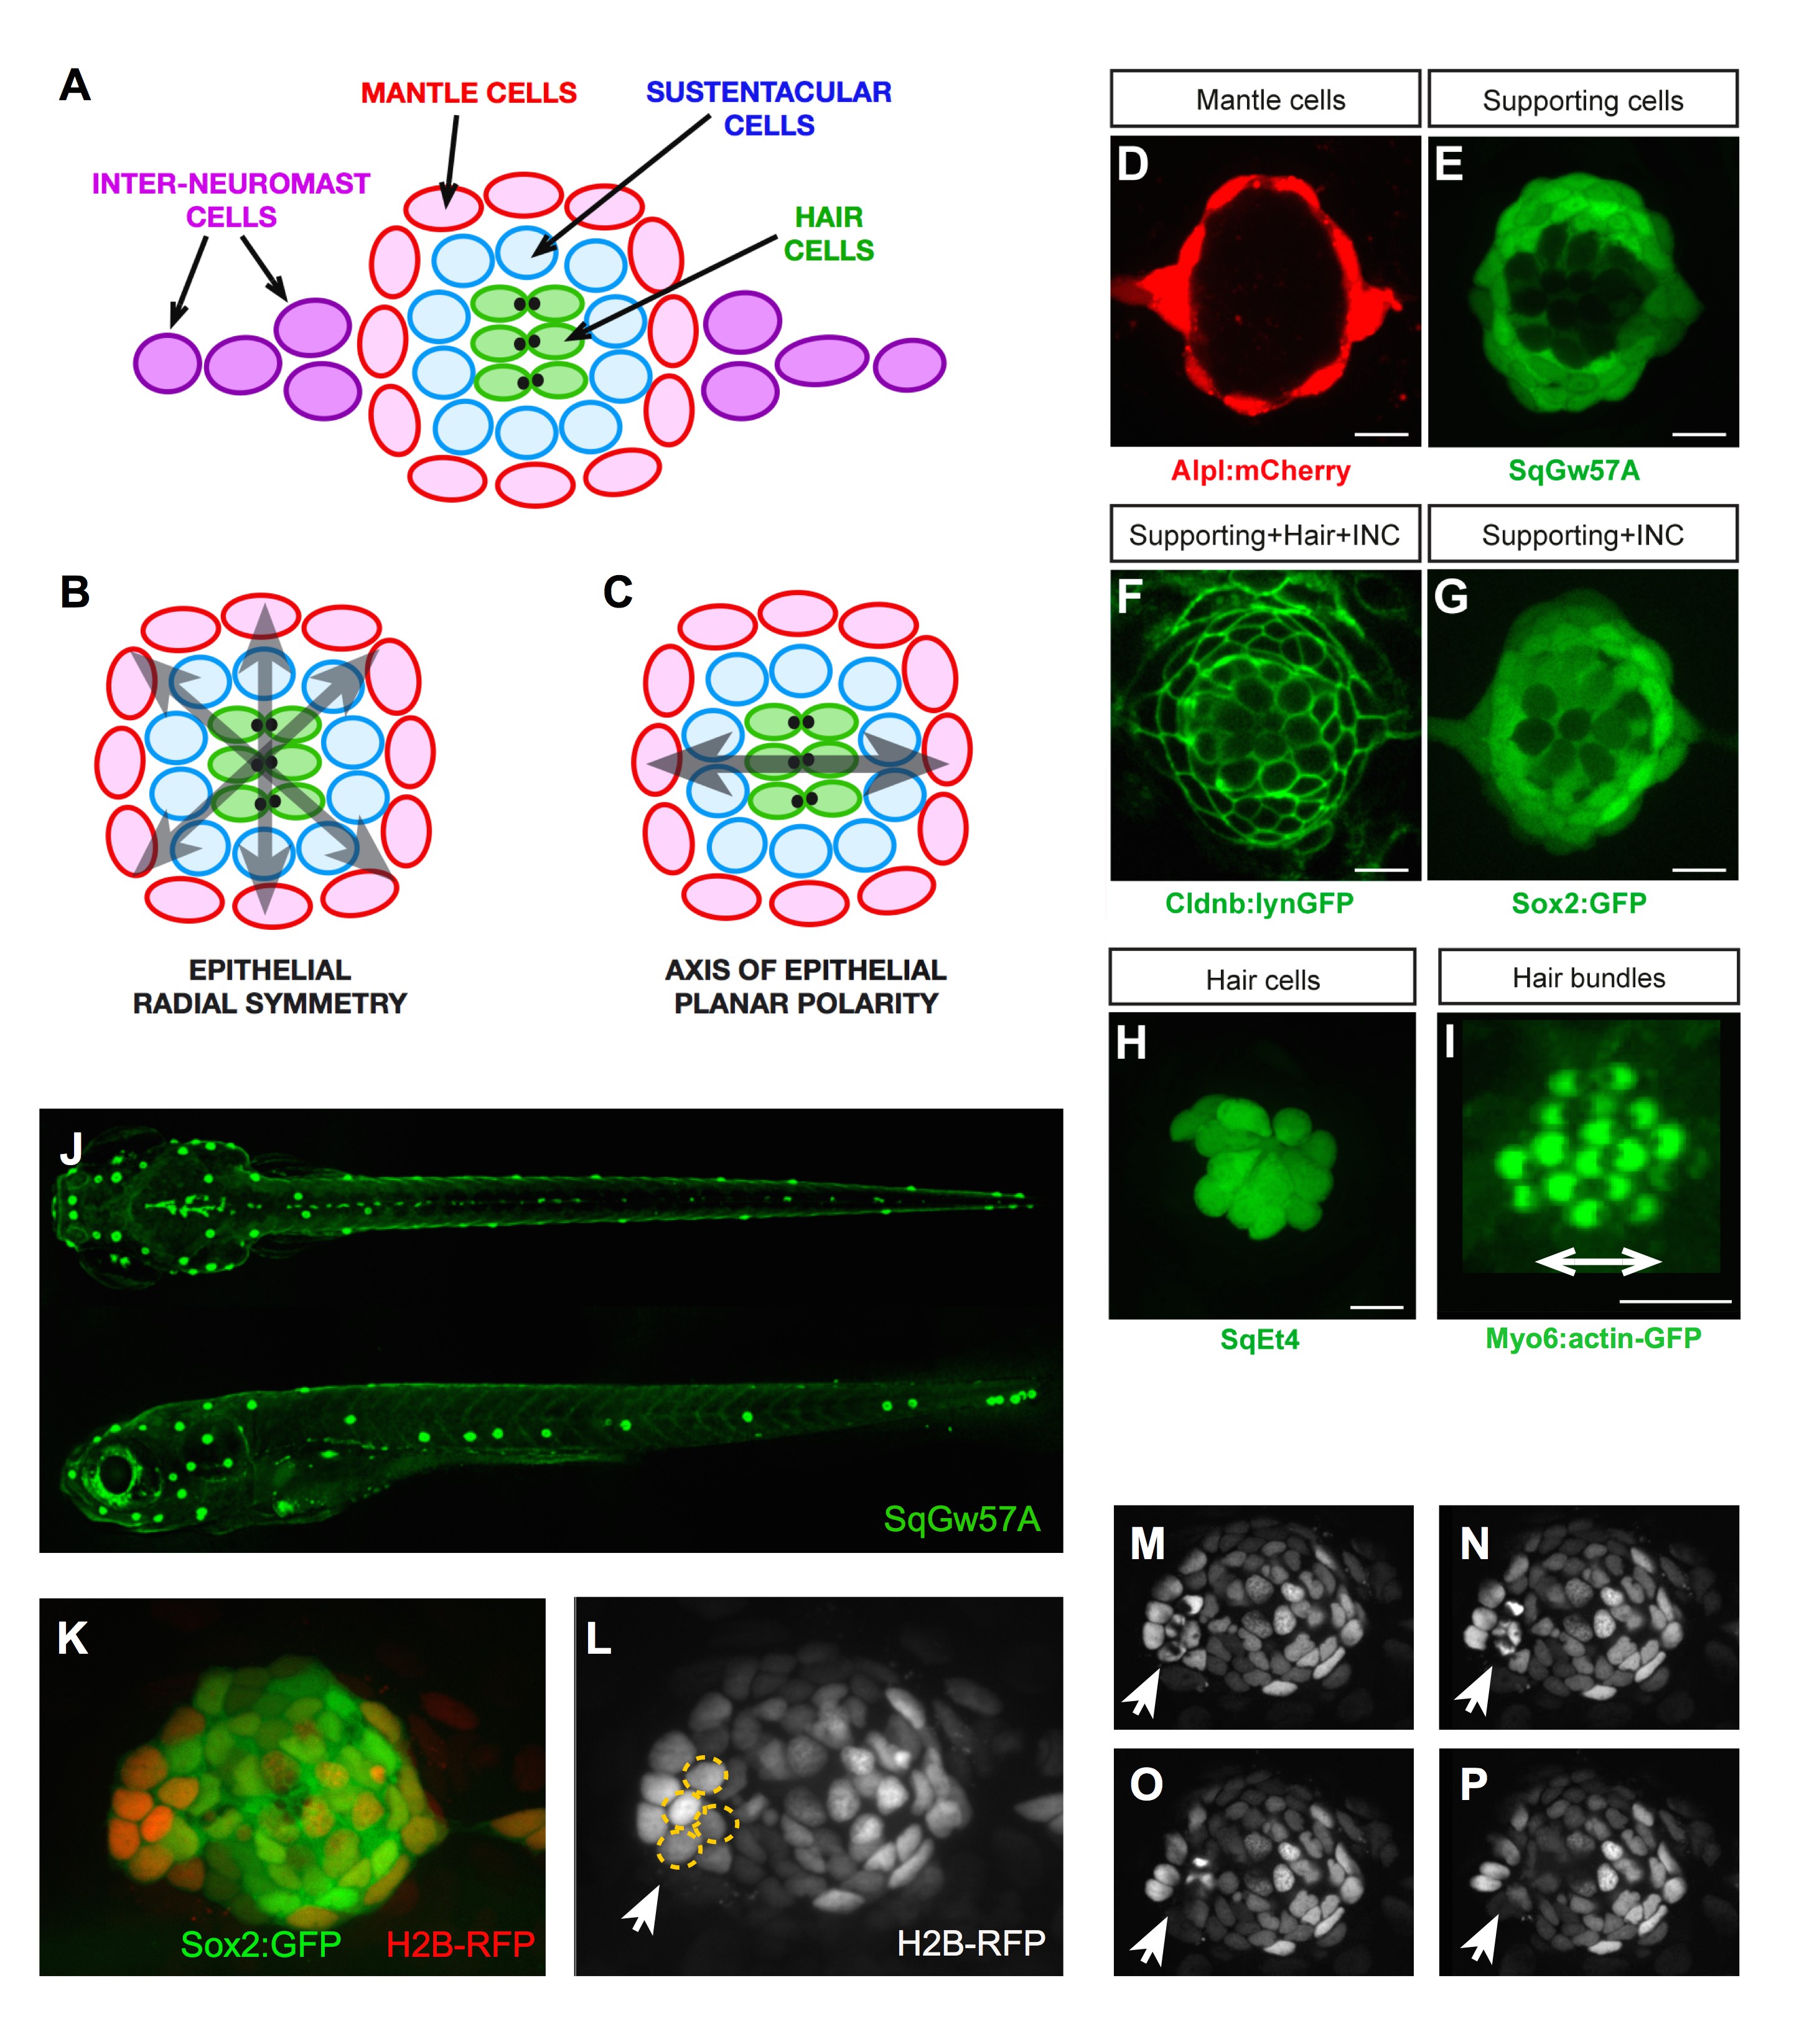
Fig. 1
Geometric organization of the neuromast.
(A–C) Schematic representation of a neuromast depicting (A) cell classes identifiable by expression of transgenic markers. Grey arrows indicate, respectively, (B) radial symmetry and (C) epithelial planar polarity. (D–I) Confocal images of cell-specific transgenic markers. (D) Alpl:mCherry marks mantle and interneuromast cells, (E) SqGw57A shows all supporting cells, (F) Cldnb:lynGFP marks all neuromast cells, (G) Sox2-GFP marks supporting and interneuromast cells, (H) SqET4 labels hair cells, and (I) Myo6b:actin-GFP highlights the planar polarization of the hair cells by decorating their apical stereocilia. Scale bars: 10 µm. (J) Images of dorsal (top) and lateral (bottom) views of a SqGw57A transgenic zebrafish larva, revealing the full complement of superficial neuromasts and their stereotypic position. (K) A single confocal section of the lateral view of a neuromast expressing GFP in supporting cells (Sox2-GFP) and a RFP in all nuclei (H2B-RFP). (L) Same neuromast in K showing RFP-marked nuclei. The white arrow indicates 4 cells (circled), which are target of the laser beam for ablation. (M–P) Four still images of the neuromast in L over a period of five minutes, in which the laser-targeted cells are eliminated from the epithelium (white arrow).