
|
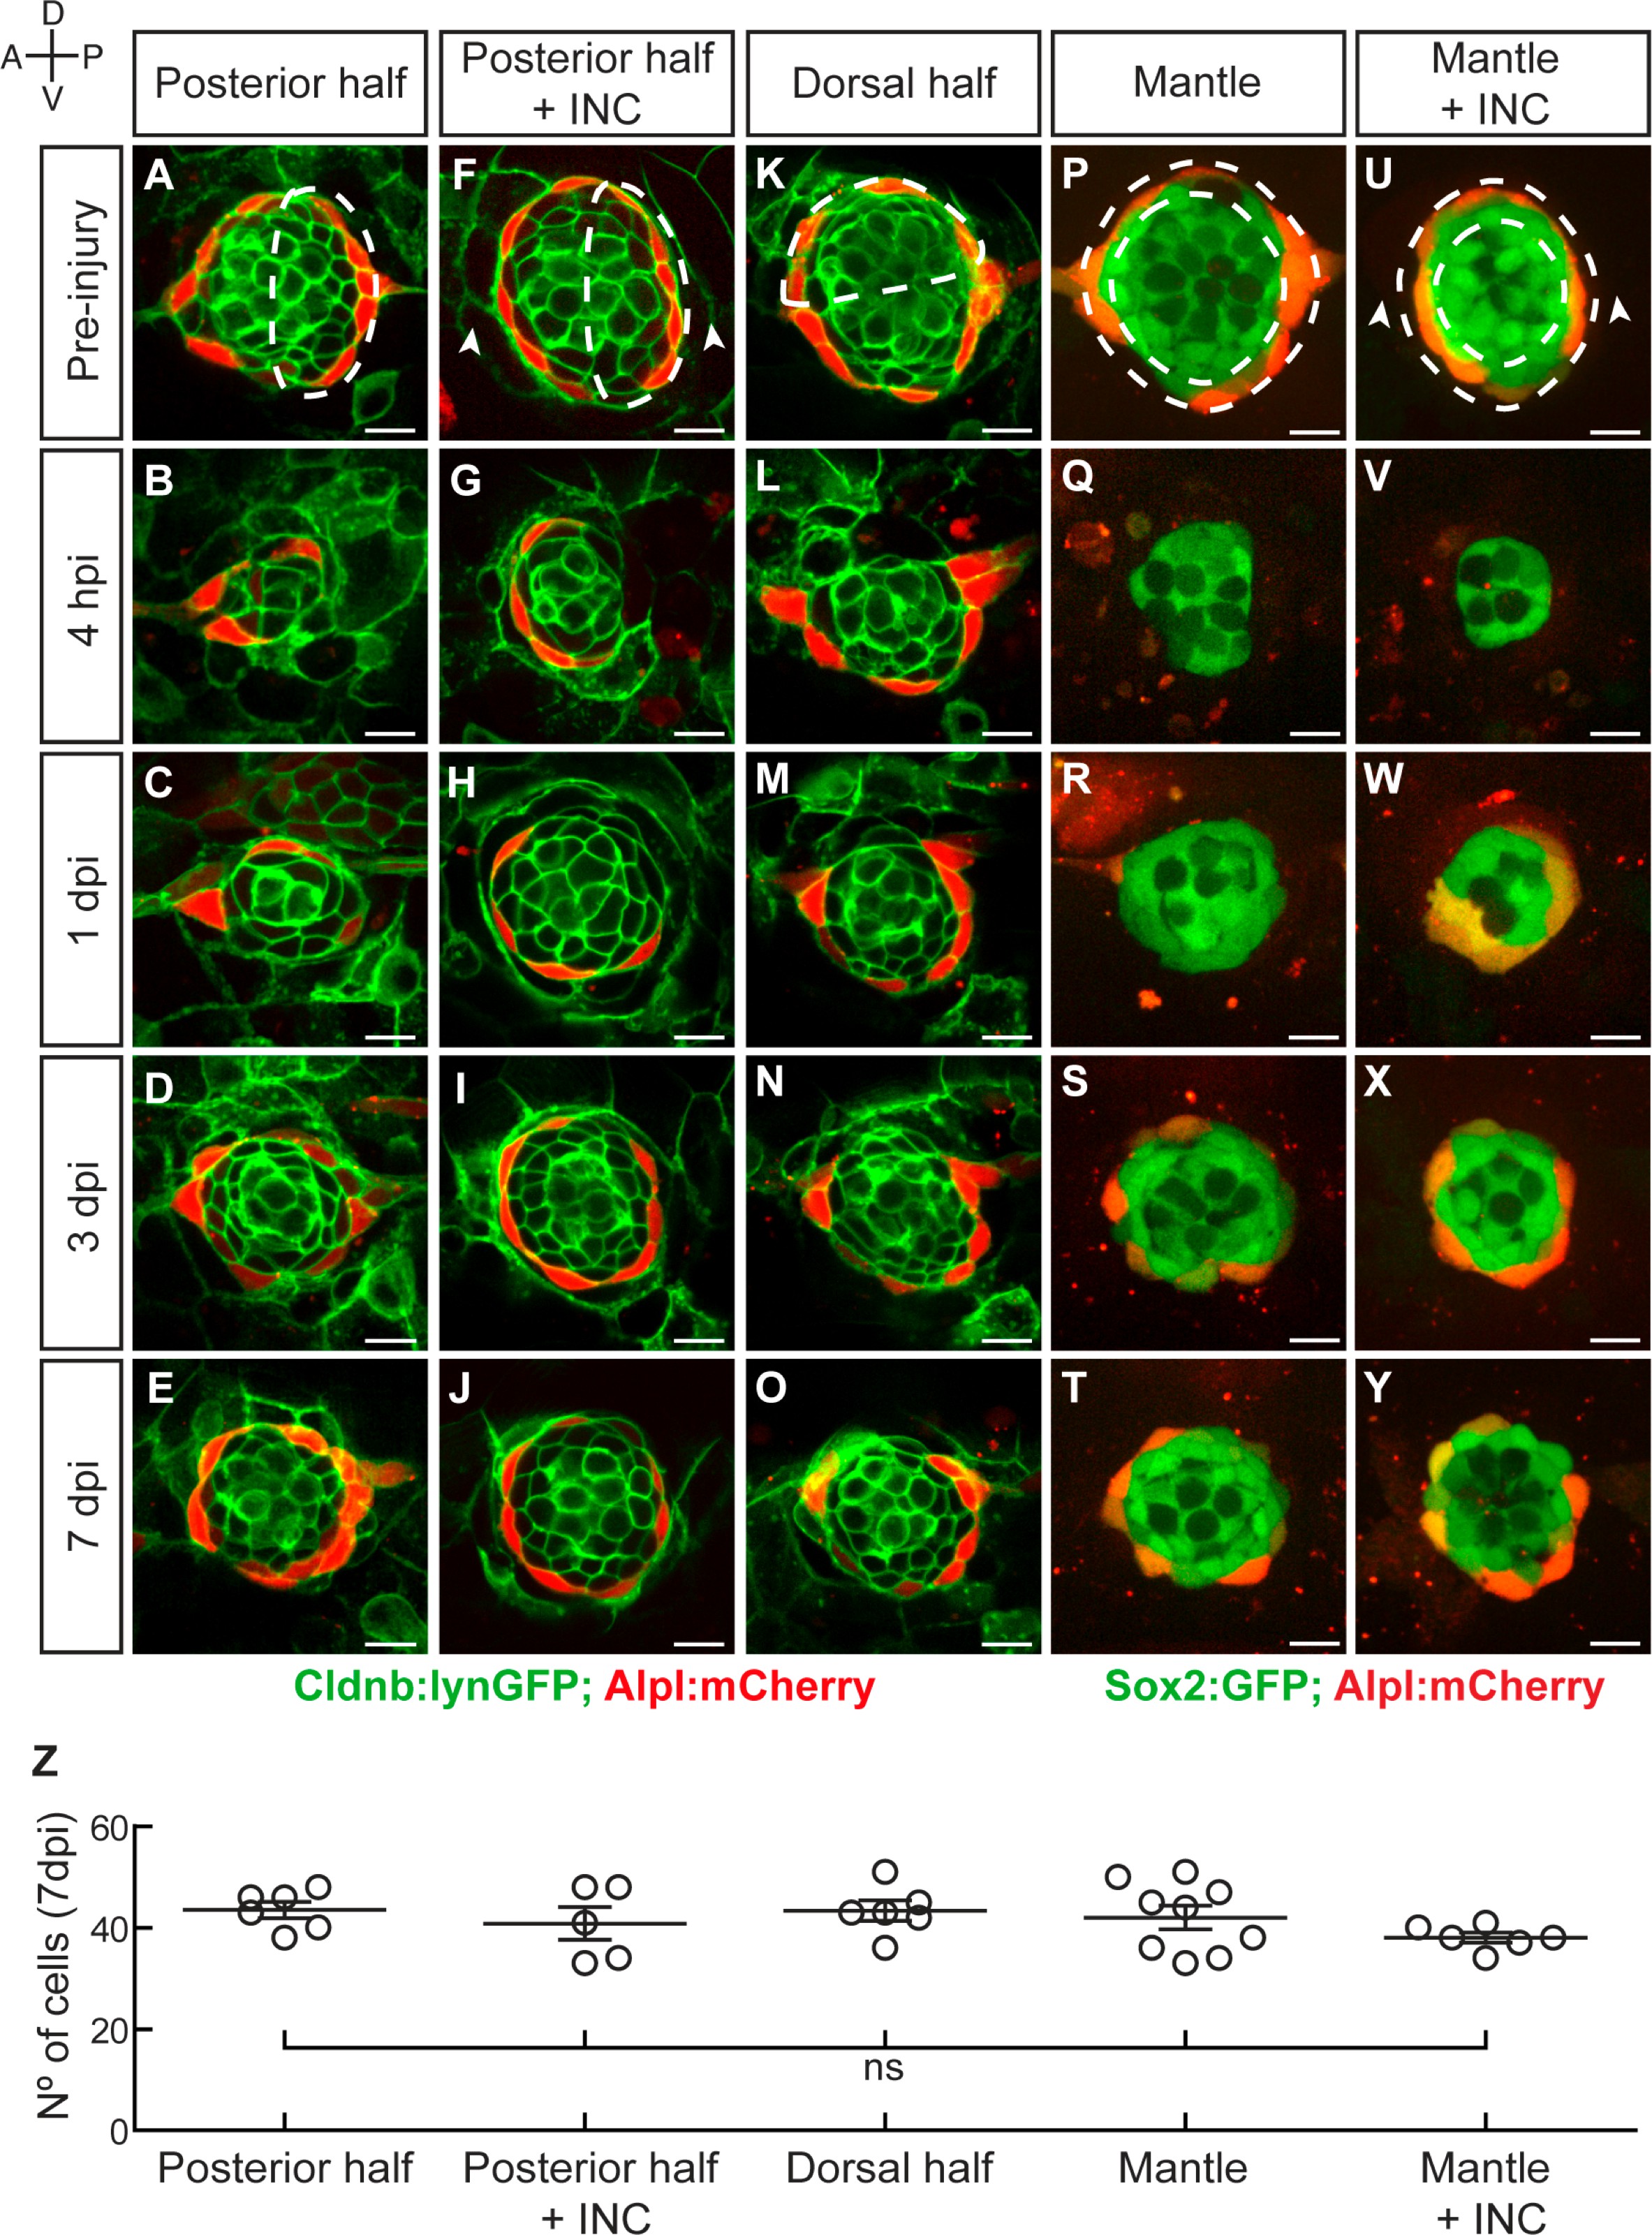
Fig. 3
Neuromasts have isotropic regenerative capacity.
(A) Ablation of the posterior half of a neuromast. (B–C) The damage is resolved by cellular movement from the undamaged site 1dpi. (D) Neuromasts recover geometric order after 3 days and (J) return to homeostasis by 7dpi. Dashed lines in A,F,K,P,U delineate the ablated area. (F–J) Simultaneous ablation of the posterior half of a neuromast and the interneuromast cells flanking its anterior and posterior sides (n = 5) led to a regeneration outcome identical to that of the experiment in (A–E). Arrowheads in (F) point the location normally occupied by the interneuromast cells. (K–O) Neuromasts depleted from their dorsal half (n = 6) also recover epithelial size, proportions and geometry in a manner indistinguishable from equatorial-side ablation after 7 days. (P–T) 7 days after their complete laser-mediated ablation, mantle cells regenerated for neuromasts to recover the mantle. (U–Y) The ablation of interneuromast cells flanking both sides of neuromasts that were depleted of mantle cells resulted in the same outcome (n = 6). (Z) Quantification of the number of cells in regenerated neuromasts at 7 dpi. Number of neuromast cells was no statistically significant between groups of different damage regimes as determined by one-way ANOVA (F(4,27)=1.013, p=0.4183). Scatter plot shows mean ±s.e.m.ns: non-significant. Scale bars: 10 µm.