
Fig. 4
- ID
- ZDB-FIG-180712-6
- Publication
- Viader-Llargués et al., 2018 - Live cell-lineage tracing and machine learning reveal patterns of organ regeneration
- Other Figures
- All Figure Page
- Back to All Figure Page
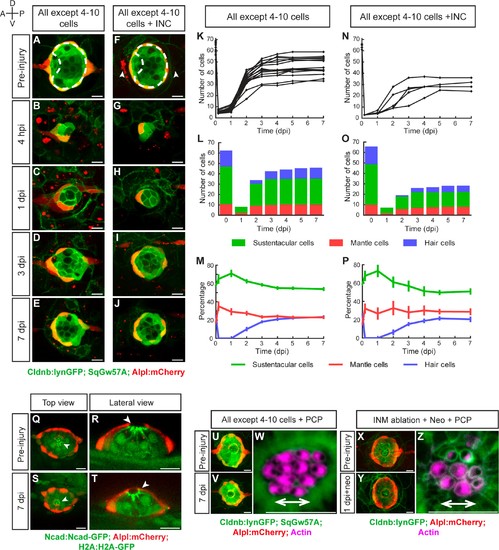
Recovery of organ architecture after loss of tissue integrity. (A–E) Confocal images of a neuromast regenerating from 4 to 10 cells during a period of 7 days. Neuromasts recover radial symmetry 3 dpi (D), and original organ proportions at 7 dpi (E). (F–J) Neuromasts reduced to 4–10 cells that were previously deprived from adjacent interneuromast cells (INCs) (arrowheads in F), regenerated and reformed radial symmetry (H–I) and proportions 7 dpi, despite maintaining a reduced size (J). Dashed circles in (A,F) illustrate damaged areas. Scale bars: 10 µm. (K,N) Total cell numbers in regenerating neuromasts over 7 days in the two conditions depicted in (A–J). (L,O) In the first 2 dpi neuromast consist almost exclusively of supporting cells (green and red). Hair cells (blue) begin to appear between at 2dpi. (M,P) Percentages of cell classes during a 7 day regeneration period. Right after damage, neuromast experience an imbalance of cell proportions that is re-established over the course of 3 days. Afterwards the neuromasts continues to slowly increase total cell number at similar rates. The final proportion of cell classes recapitulates that of the starting condition. Time points show mean ± s.e.m. [All except 4–10 cells] n = 15, [All except 4–10 cells + INC] n = 6. (Q) Top and (R) lateral views of a triple-transgenic Tg[Ncad: Ncad-EGFP; Alp:mCherry; H2A:H2A-EGFP] neuromast before injury. (S) Top and (T) lateral views of a regenerated neuromast 7 days post injury (n = 4). Basal location of nuclei and apical N-cadherin enrichment evidence the apicobasal polarization of the organ. The accumulation of N-cadherin (white arrowheads) in the regenerated neuromast shows that apical constrictions are properly re-established during the process. (U–V) Maximal intensity projection of a neuromast in the triple transgenic line Tg[Cldnb:lynGFP; SqGw57A; Alpl:mCherry] prior to injury that eliminates all except 4 to 10 cells (U), and the same neuromast 7 days after damage (V). (W) Hair-bundle staining with rhodamine-phalloidin (colored in pink) reveals the coherent planar polarization of the hair cells in the regenerated neuromast shown in (V). (X) Confocal projection of a neuromast before the removal of flanking interneuromast cells. (Y) Maximal projection of a neuromast 48 hr after interneuromast-cell ablation and 24 hr after neomycin treatment. (Z) Phalloidin staining of hair bundles of hair cells regenerated in the absence of interneuromast cells, showing recovery of coherent epithelial planar polarity. Scale bars: 10 µm. |