
- Title
-
Assaying sensory ciliopathies using calcium biosensor expression in zebrafish ciliated olfactory neurons
- Authors
- Bergboer, J.G.M., Wyatt, C., Austin-Tse, C., Yaksi, E., Drummond, I.A.
- Source
- Full text @ Cilia
Olfactory epithelium (OE) in 2.5-dpf zebrafish. Multi-ciliated motile cilia are present at the border, ciliated OSNs in the centre; maximum intensity projection. a Basal bodies stained with anti-cep290 (red), a’ cilia stained with anti-acetylated tubulin (green), a” merged image. Inset in a” closeup of sensory (left) and motile (right) cilia showing basal body staining of anti-Cep290. b EM image of dendritic knob of ciliated zebrafish OSNs containing multiple basal bodies (arrowheads). c Tg(omp:mCherry,trpc2:Venus) zebrafish with ciliated Omp-positive OSNs (red) and c’ microvillus TrpC2-positive OSNs (green), c” merged image; single confocal section. d Quantification of C, N = 5 fish. e Tg(omp:mCherry,elavl3:GCaMP5) zebrafish show overlap between ciliated Omp-positive OSNs (red) and e’ GCaMP5-positive OSNs (green) OSNs, e” merged single confocal section. f Quantification of E, N = 6 fish. Bars represent mean and SEM. Scale bar is 10 µm, except b bar is 1 µm |
Cilia defects have functional effects in OSNs in Ift-deficient zebrafish at 2.5 dpf. a Anti-acetylated tubulin (green) stains all cilia axonemes in wildtype embryos as well as neuronal processes projecting away from the olfactory placode. a’ Anti-Ga/olf (red) is a marker for OSN cilia. a” Merged image of a and a’. b ift88 mutant homozygotes show loss of acetylated tubulin positive axonemes and b’ loss of anti-Ga/olf staining. b” Merged image of b and b’. c Control morpholino injected olfactory placode stained with anti-acetylated tubulin and c’ anti-Ga/olf. c” Merged image of c and c’. d ift172 morphant olfactory placodes show loss of anti-acetylated tubulin staining and d’ loss of anti-Ga/olf staining. d” Merged image of d and d’. Remaining anti-acetylated tubulin staining is restricted to neuronal processes [67] (b, d). For quantification see Table 1. e Significant change in percentage of odour responding OSNs per embryo after addition of bile acids and food odour in Tg(elavl3:GCaMP5) ift88 mutant OSNs compared to sibling OSNs (N = 637 OSNs, 10 fish for sibling and N = 720 OSNs, 9 fish for mutant). f Significantly reduced response amplitude to bile acids and food odour in Tg(elavl3:GCaMP5) ift88 mutant responding OSNs compared to sibling responding OSNs. g Whole mount in situ hybridization using an omp probe demonstrates clear omp expression in the OE in both wild type siblings g and g’ ift88 mutants and siblings at 2 dpf. (For other time points see Additional file 1: Fig. S6A). h Ciliated OSNs stained with anti-GFP (green) and anti-Ga/olf (red) present in both h sibling and h’ ift88 mutant, based on cell shape (arrows) in Tg(elavl3:GCaMP5) fish. i No difference in number of GCaMP5 positive OSNs per fish (P = 0.10). Bars represent mean and SEM (*P < 0.05, **P < 0.01, ***P < 0.001 Mann–Whitney U test for e and f, student’s t test for i. Scale bar is 10 μm, except panel g bar is 100 μm |
Effect of ift172-deficiency on cilia-dependent olfactory sensory neuron signalling in 2.5-dpf-old zebrafish. a Significant change in percentage of responding cells per embryo to nucleotides in Tg(elavl3:GCaMP5) ift172 MO OSNs compared to control MO OSNs (N = 517 OSNs, 5 fish for control MO and N = 495 OSNs, 6 fish for ift172 MO). b Significantly reduced response amplitude to bile acids and food odour in Tg(elavl3:GCaMP5) ift172 MO responding OSNs compared to control MO responding OSNs. c No difference in Omp-positive OSNs between control and ift172 MO Tg(omp:gal4,UAS:YPF) fish. d Quantification of C (N = 3 control MO, N = 4 ift172 MO, P = 0.33). e No difference in number of GCaMP5-positive OSNs per embryo (P = 0.16). Bars represent mean and SEM (*P < 0.05, **P < 0.01, ***P < 0.001 Mann–Whitney U test for a, b, Student’s t test for d, e). Scale bar is 10 µm |
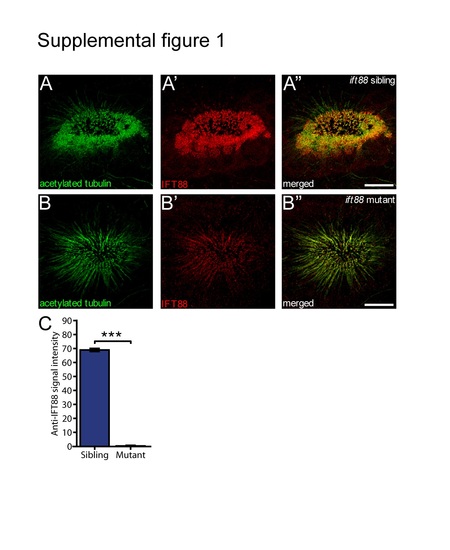
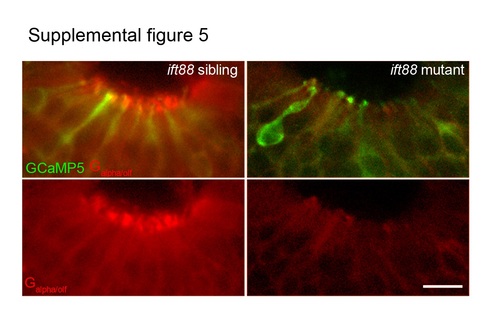
Severe reduction of IFT88 protein (anti-IFT88 antibody in red) expression is present in the cilia of the OE (marked by anti-acetylated tubulin staining) of the ift88 mutant (B) compared to the ift88 wildtype sibling (A). (C) Quantification of the signal in the red (IFT88) channel demonstrated a 99% decrease in intensity of the red staining. (N=3 fish per condition, P=5.5E-7, Student's t-test). Bars represent mean and SEM. Scale bar is 10 µm. |
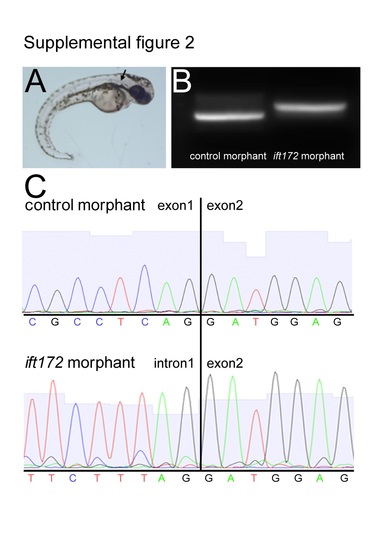
(A) Phenotype of ift172 MO fish, arrow points at kidney cyst. (B) Larger ift172 PCR product using ift172 cDNA as a template in ift172 morphant. (C) Sequence analysis reveals that injection of ift172 MO leads to retention of intron 1 in cDNA of morphants, leading to a predicted 16 amino acids peptide instead of the 1745 amino acids of the original protein. |
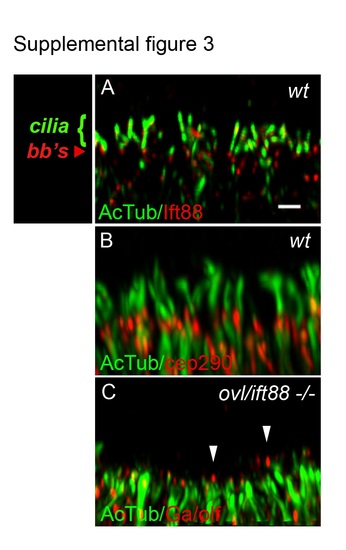
Olfactory sensory cilia deficit in oval/ift88 -/- mutants. (A) Olfactory sensory cilia in the center of a wild type olfactory placode stained with anti-Ift88 (red) and anti-acetylated tubulin (green; cilia) and imaged in confocal Z-stacks. Ift88 immunoreactivity was strongest in basal bodies (bb's). Scale bar in (A) equals 1 µm. (B) Wild type olfactory placode stained with anti-acetylated tubulin (green; cilia and neuronal cell body processes) and anti-cep290 (red; basal bodies). (C) oval mutant olfactory placode stained with anti-G /olf (red) and anti-acetylated tubulin (green) shows cilia loss with some short, residual G /olf-positive axonemes (arrowheads). All panels are set at equivalent scale and represent a 3µm thick maximum intensity projection of the center of the olfactory placode. |
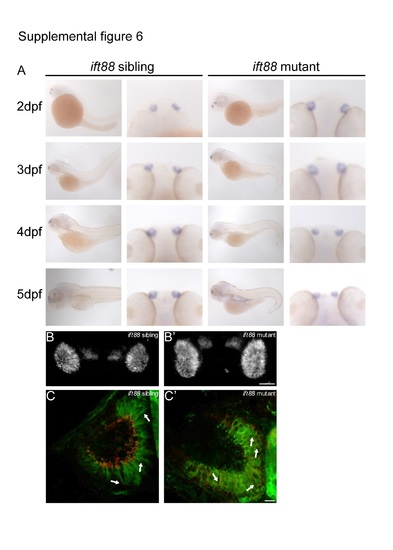
(A) Whole mount in situ hybridization using the omp probe showing omp expression in olfactory epithelia both in ift88 mutants and wildtype siblings at 2, 3, 4, and 5 dpf. (B) Tg(omp:mCherry) fish demonstrate presence of Omp-positive OSNs in ift88 wildtype siblings (B) and ift88 mutants (B') at 5 dpf. (C) Anti-GFP (green) and anti-G /olf (red) staining shows presence of ciliated OSNs in the ift88 wildtype sibling, in the ift88 mutant omp-positive cells are detected based on their characteristic flask like shape (arrows) in Tg(elavl3:GCaMP5) fish at 6 dpf. Scale bar is 50 µm in B, and 10 µm in C. |
Ciliated OSNs stained with anti-GFP (green) and anti-G /olf (red) present in both sibling and ift88 mutant. Lower panels: the anti-G /olf (red) signal only, demonstrating presence of anti-G /olf (red) staining in the cell bodies of both sibling and ift88 mutant. Scale bar is 10 µm. |
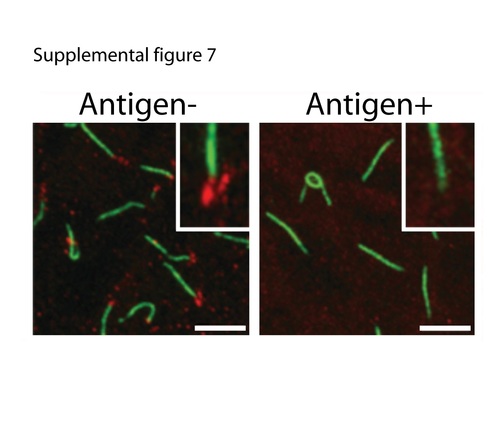
Anti-Cep290 antibody validation. In a 10 somite stage zebrafish embryo, the Cep290CT antibody (red) stain punctate structures at the base of Kuppfer's vesicle cilia (anti-acetylated tubulin in green). Staining is lost when the antibodies are preincubated with antigen, demonstrating antibody specificity. Inset: magnified view of a single basal body region. Scale bar is 5 µm. |
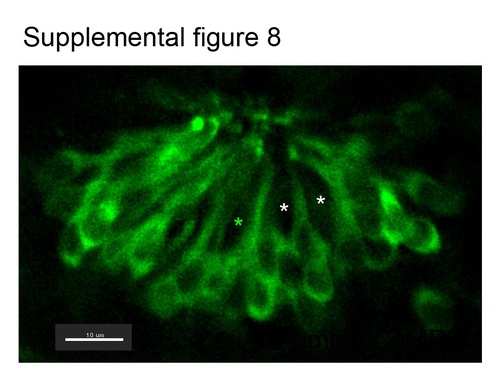
GCaMP6f expression in the olfactory placode in 2.5 dpf Tg(omp:GCaMP6) larvae. GCaMP6f in Tg(omp:GCaMP6) larvae was selectively expressed in flask shaped OSNs, representing a subset of ciliated OSNs adjacent to non-expressing (asterisk), presumably microvillus OSNs (see figure 1). |