
- Title
-
Genetic compensation triggered by actin mutation prevents the muscle damage caused by loss of actin protein
- Authors
- Sztal, T.E., McKaige, E.A., Williams, C., Ruparelia, A.A., Bryson-Richardson, R.J.
- Source
- Full text @ PLoS Genet.

ZFIN is incorporating published figure images and captions as part of an ongoing project. Figures from some publications have not yet been curated, or are not available for display because of copyright restrictions. |

Characterization of muscle phenotypes in actc1b-/- mutants and Actc1b morphants. A) Antibody labelling against Actinin2 and Phalloidin of actc1b-/- mutants and wildtype siblings with Actinin2 (green) and F-actin (red) at 2 dpf and 6 dpf showing normal muscle morphology. Scale bar represents 50μm. B) Locomotion assays show a significant reduction in distance travelled by actc1b-/- mutants compared to siblings (actc1b+/- and actc1b+/+) zebrafish. Error bars represent SEM for three independent experiment (n = 6,11,16 for actc1b+/+; n = 24,23,18 for actc1b+/-; and n = 13,9,10 for actc1b-/- per experiment), *p<0.05 using a one-way ANOVA. C) Locomotion assays showing a significant reduction in distance travelled by Actc1b ex2 and UTR morphants compared to both Standard Control MO injected and uninjected zebrafish. No significant difference in locomotion is observed for Standard Control MO injected and uninjected zebrafish. Error bars represent median values and interquartile range (pooled samples from 3 independent experiments n = 45,48,46 for Actc1b ex2 MO; n = 45,48,33 for Actc1b UTR MO; n = 45,48,47 for Standard Control MO; and n = 48,47,45 for uninjected zebrafish), #p<0.0001 using a Kruskal-Wallis Test. |

Characterization of phenotypic severity following Actc1b morpholino knockdown. A) actc1b-/- and wildtype siblings (actc1b+/- and actc1b+/+) injected with either an Actc1b ex2, Actc1b UTR or Standard Control morpholino were stained with Actinin2 (green) and F-actin (red) and phenotypes were scored as either wildtype, mild (small outgrowth of aggregates at the myosepta (arrowheads)) or severe (large outgrowth of aggregates at the myosepta (arrowheads) and Actinin2 positive aggregates throughout the muscle fibers (arrows)). Scale bar represents 50μm. B) Quantification of phenotypic severity for actc1b-/- and wildtype siblings injected with Actc1b ex2 and Actc1b UTR MOs compared to Standard Control MO injected zebrafish. Error bars represent SEM for three independent experiments (for Actc1b ex2 MO: n = 26,14,16 actc1b+/+, n = 31,35,29 actc1b+/- and n = 12,11,23 actc1b-/-, for Actc1b UTR MO: n = 23,21,17 actc1b+/+, n = 28,30,23 actc1b+/- and n = 8,11,8 actc1b-/- and for Standard Control MO: n = 11,8,10 actc1b+/+, n = 11,13,11 actc1b+/- and n = 9,12,4 actc1b-/-), #p<0.0001 using a Chi-square test. C) Locomotion assays show a significant reduction in distance travelled by actc1b+/+ injected with an Actc1b UTR MO and Actc1b ex2 MO compared to Standard Control MO, using a Kruskal-Wallis Test. Locomotion assays show a significant reduction in distance travelled by actc1b+/- injected with an Actc1b ex2 MO compared to Control MO, using a Kruskal-Wallis Test. No difference in distance travelled is observed between actc1b-/- mutants injected with either an Actc1b UTR MO, Actc1b ex2 MO or Standard Control MO. Error bars represent median values with interquartile range (pooled samples from 3 independent experiments for Actc1b ex2 MO: n = 25,21,20 actc1b+/+, n = 41,53,49 actc1b+/- and n = 20,14,15 actc1b-/-, for Actc1b UTR MO: n = 30,24,19 actc1b+/+, n = 42,47,57 actc1b+/- and n = 21,23,17 actc1b-/- and for Standard Control MO: n = 31,28,26 actc1b+/+, n = 41,50,52 actc1b+/- and n = 21,14,17 actc1b-/-). *p<0.05 and #p<0.0001. |
|
ZFIN is incorporating published figure images and captions as part of an ongoing project. Figures from some publications have not yet been curated, or are not available for display because of copyright restrictions. |
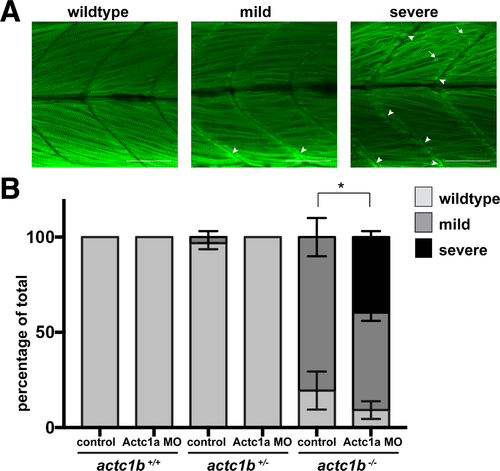
Characterization of phenotypic severity following Actc1a morpholino knockdown. A) actc1b-/- and wildtype siblings (actc1b+/- and actc1b+/+) injected with either an Actc1a splice or Standard Control MO were stained with Actinin2 and phenotypes were scored as either wildtype, mild (small outgrowth of aggregates at the myosepta (arrowheads)) or severe (large outgrowth of aggregates at the myosepta (arrowheads) and Actinin2 positive aggregates throughout the muscle fibers (arrows)). Scale bar represents 50μm. B) Quantification of the phenotypic severity for actc1b-/- and wildtype siblings (actc1b+/+ and actc1b+/-) injected with Actc1a splice compared to Standard Control MO injected zebrafish. Error bars represent SEM for three independent experiments (for Actc1a MO n = 8,13,7 actc1b+/+, n = 27,16,16 actc1b+/- and n = 7,15,7 actc1b+/+ and for Standard Control MO n = 7,3,7 actc1b+/+, n = 16,21,20 actc1b+/- and n = 4,8,6 actc1b-/-), *p<0.05 indicates a significant difference in phenotype proportions using a Chi-square test. PHENOTYPE:
|
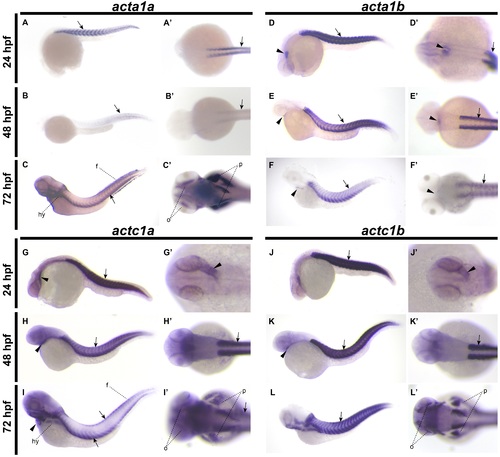
In situ hybridization of acta1 and actc1 genes during zebrafish embryogenesis. acta1a is expressed in the trunk skeletal muscle (arrows) at 24 hpf (A, A’), 48 hpf (B, B’) and 72 hpf (C, C’) and in the ocular muscle (o), developing pectoral fins (p), fin folds (f), hypaxial muscle (hy) and in the head musculature at 72 hpf (C, C’). acta1b is expressed in the heart (arrowheads) and trunk skeletal muscle (arrows) at 24 hpf (D, D’), 48 hpf (E, E’) and 72 hpf (F, F’). actc1a is expressed in the heart (arrowheads) and skeletal muscle (arrows) at 24 hpf (G, G’) and 48 hpf (H, H’), with expression in the skeletal muscle localized to the outer edges of the trunk muscle at 72 hpf (I, I’). actc1a is expressed in the ocular muscles (o), developing pectoral fins (p), fin folds (f), hypaxial muscle (h) and in the head musculature at 72 hpf (I, I’). actc1b is expressed in the heart (arrowheads) and trunk skeletal muscle (arrows) at 24 hpf (J, J’), 48 hpf (K, K’) and in the trunk skeletal muscle at 72 hpf (L, L’). actc1b is also expressed in the ocular muscles (o), developing pectoral fins (p), hypaxial muscle (h) and in the head musculature (h) at 72 hpf (L, L’). EXPRESSION / LABELING:
|

Analysis of Actc1a MO phenotype. A) RT-PCR analysis for actc1a following Actc1a MO knockdown. The lower band (arrow) is the expected RT-PCR product of 214bp appearing in both Actc1a MO injected and uninjected embryos. The upper band (arrowhead) appears in the Actc1a MO injected embryos, becoming more apparent as the MO concentration increases, and represents the inclusion of intron 2 resulting from mis-splicing at the exon1/intron2 boundary. B) Western blot analysis and C) quantification of α-actin protein expression in wildtype zebrafish at 2 dpf resulting from increasing doses of Actc1a MO or Standard Control MO, comprising 25 whole embryos. α-actin protein levels were normalized against the β-tubulin loading control. D) Brightfield and cascade blue images of 2 dpf zebrafish embryos injected with increasing doses of Actc1a MO showing the appearance of a dilated heart (arrowheads) in 1.0ng and 2.0ng morphants compared to uninjected controls. Cascade blue was used to identify MO-injected embryos. E) Actinin2 staining of the trunk muscle at 2 dpf reveals no abnormalities in Actc1a MO injected embryos compared to uninjected controls. |