
|
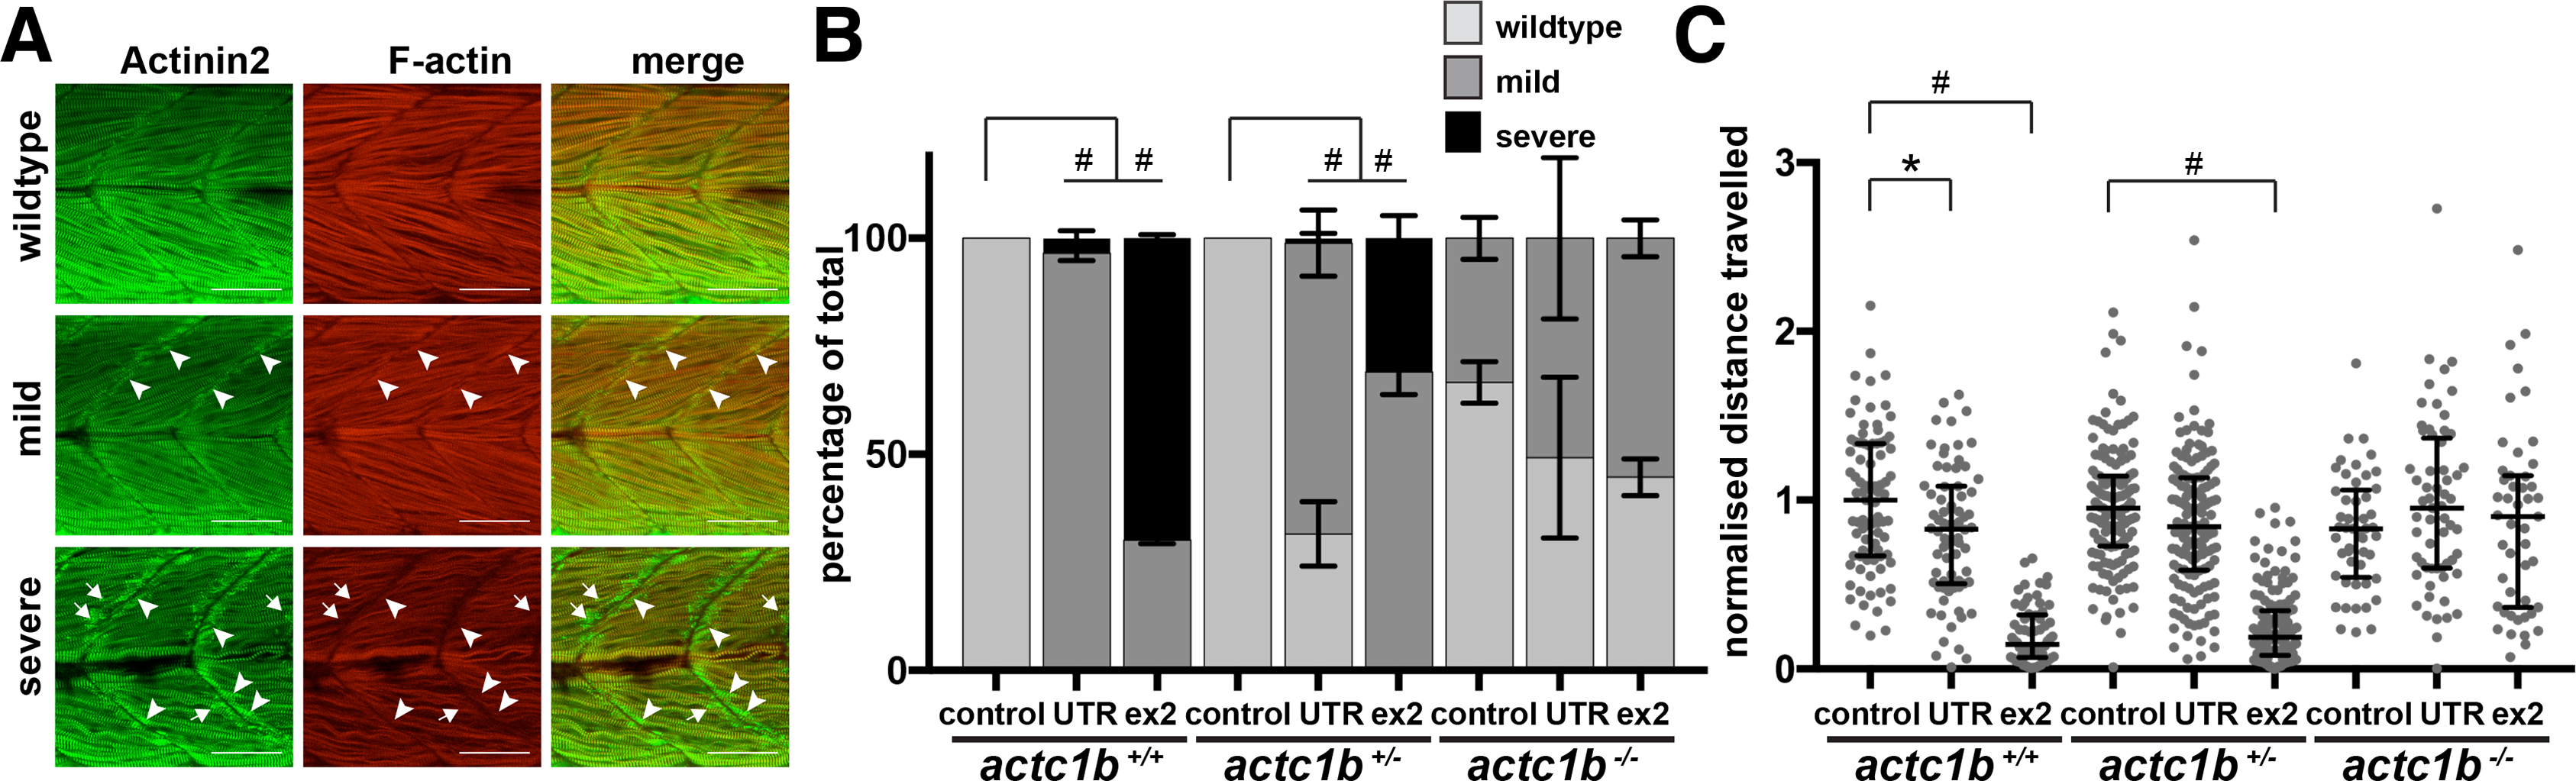
Fig. 3
Characterization of phenotypic severity following Actc1b morpholino knockdown.
A) actc1b-/- and wildtype siblings (actc1b+/- and actc1b+/+) injected with either an Actc1b ex2, Actc1b UTR or Standard Control morpholino were stained with Actinin2 (green) and F-actin (red) and phenotypes were scored as either wildtype, mild (small outgrowth of aggregates at the myosepta (arrowheads)) or severe (large outgrowth of aggregates at the myosepta (arrowheads) and Actinin2 positive aggregates throughout the muscle fibers (arrows)). Scale bar represents 50μm. B) Quantification of phenotypic severity for actc1b-/- and wildtype siblings injected with Actc1b ex2 and Actc1b UTR MOs compared to Standard Control MO injected zebrafish. Error bars represent SEM for three independent experiments (for Actc1b ex2 MO: n = 26,14,16 actc1b+/+, n = 31,35,29 actc1b+/- and n = 12,11,23 actc1b-/-, for Actc1b UTR MO: n = 23,21,17 actc1b+/+, n = 28,30,23 actc1b+/- and n = 8,11,8 actc1b-/- and for Standard Control MO: n = 11,8,10 actc1b+/+, n = 11,13,11 actc1b+/- and n = 9,12,4 actc1b-/-), #p<0.0001 using a Chi-square test. C) Locomotion assays show a significant reduction in distance travelled by actc1b+/+ injected with an Actc1b UTR MO and Actc1b ex2 MO compared to Standard Control MO, using a Kruskal-Wallis Test. Locomotion assays show a significant reduction in distance travelled by actc1b+/- injected with an Actc1b ex2 MO compared to Control MO, using a Kruskal-Wallis Test. No difference in distance travelled is observed between actc1b-/- mutants injected with either an Actc1b UTR MO, Actc1b ex2 MO or Standard Control MO. Error bars represent median values with interquartile range (pooled samples from 3 independent experiments for Actc1b ex2 MO: n = 25,21,20 actc1b+/+, n = 41,53,49 actc1b+/- and n = 20,14,15 actc1b-/-, for Actc1b UTR MO: n = 30,24,19 actc1b+/+, n = 42,47,57 actc1b+/- and n = 21,23,17 actc1b-/- and for Standard Control MO: n = 31,28,26 actc1b+/+, n = 41,50,52 actc1b+/- and n = 21,14,17 actc1b-/-). *p<0.05 and #p<0.0001.