
|
Fig. 2
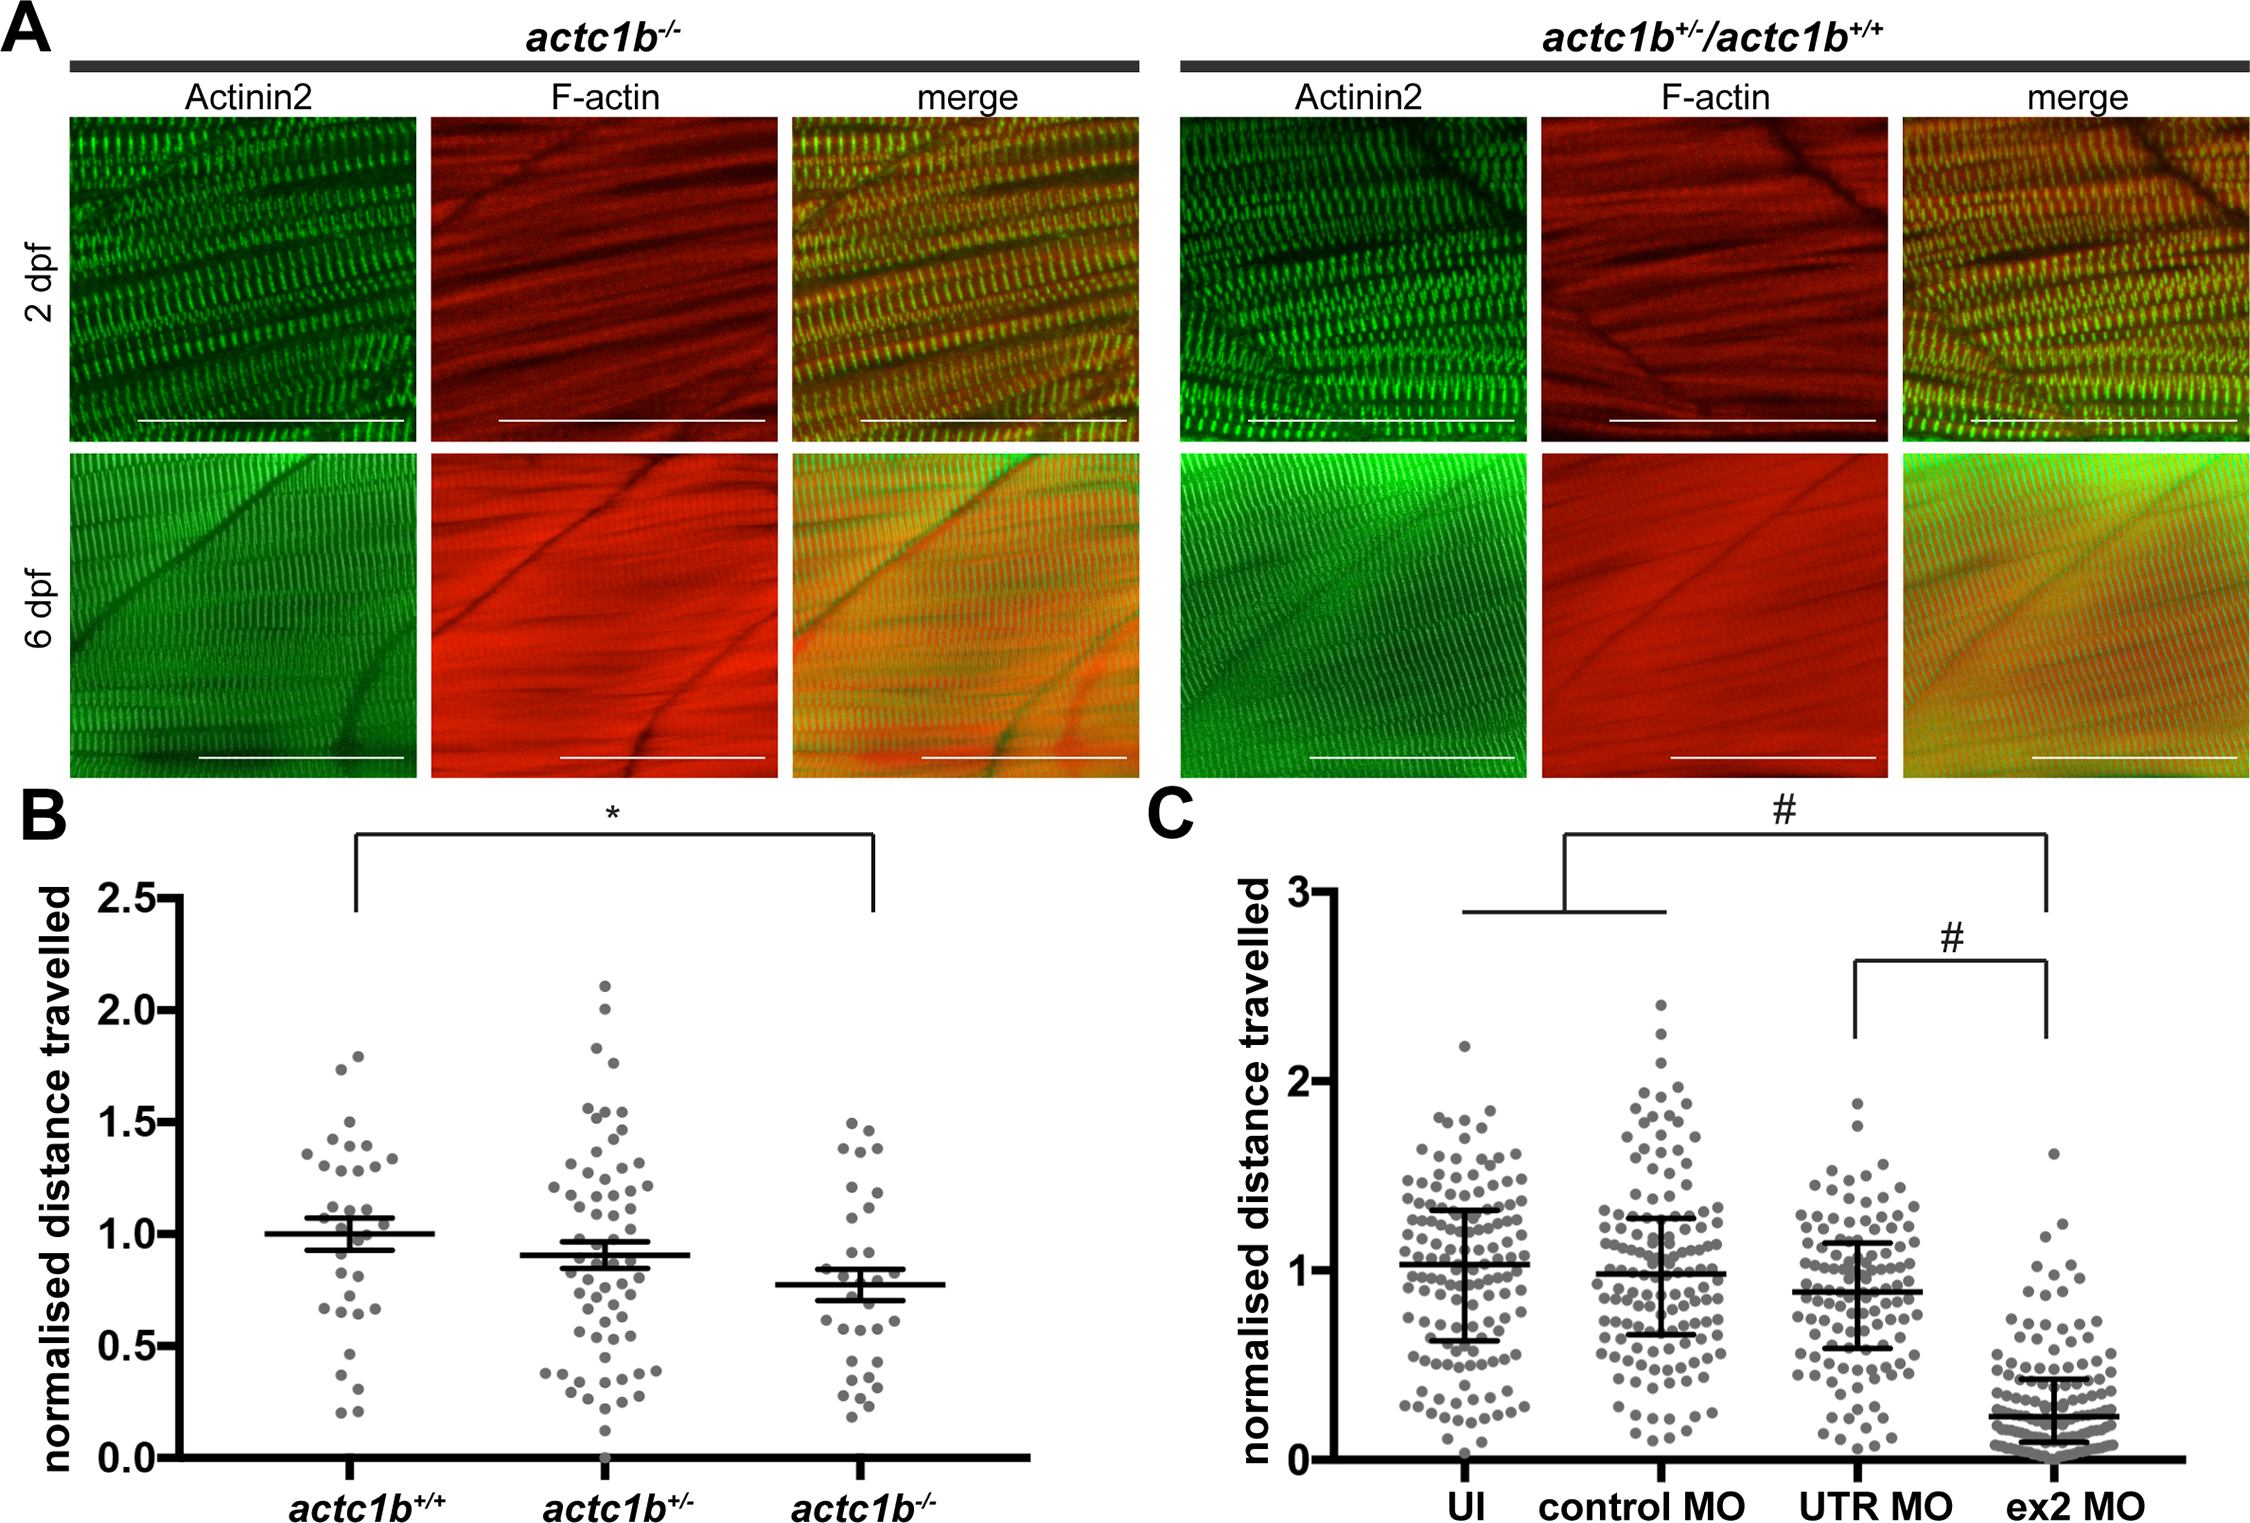
Characterization of muscle phenotypes in actc1b-/- mutants and Actc1b morphants.
A) Antibody labelling against Actinin2 and Phalloidin of actc1b-/- mutants and wildtype siblings with Actinin2 (green) and F-actin (red) at 2 dpf and 6 dpf showing normal muscle morphology. Scale bar represents 50μm. B) Locomotion assays show a significant reduction in distance travelled by actc1b-/- mutants compared to siblings (actc1b+/- and actc1b+/+) zebrafish. Error bars represent SEM for three independent experiment (n = 6,11,16 for actc1b+/+; n = 24,23,18 for actc1b+/-; and n = 13,9,10 for actc1b-/- per experiment), *p<0.05 using a one-way ANOVA. C) Locomotion assays showing a significant reduction in distance travelled by Actc1b ex2 and UTR morphants compared to both Standard Control MO injected and uninjected zebrafish. No significant difference in locomotion is observed for Standard Control MO injected and uninjected zebrafish. Error bars represent median values and interquartile range (pooled samples from 3 independent experiments n = 45,48,46 for Actc1b ex2 MO; n = 45,48,33 for Actc1b UTR MO; n = 45,48,47 for Standard Control MO; and n = 48,47,45 for uninjected zebrafish), #p<0.0001 using a Kruskal-Wallis Test.