
|
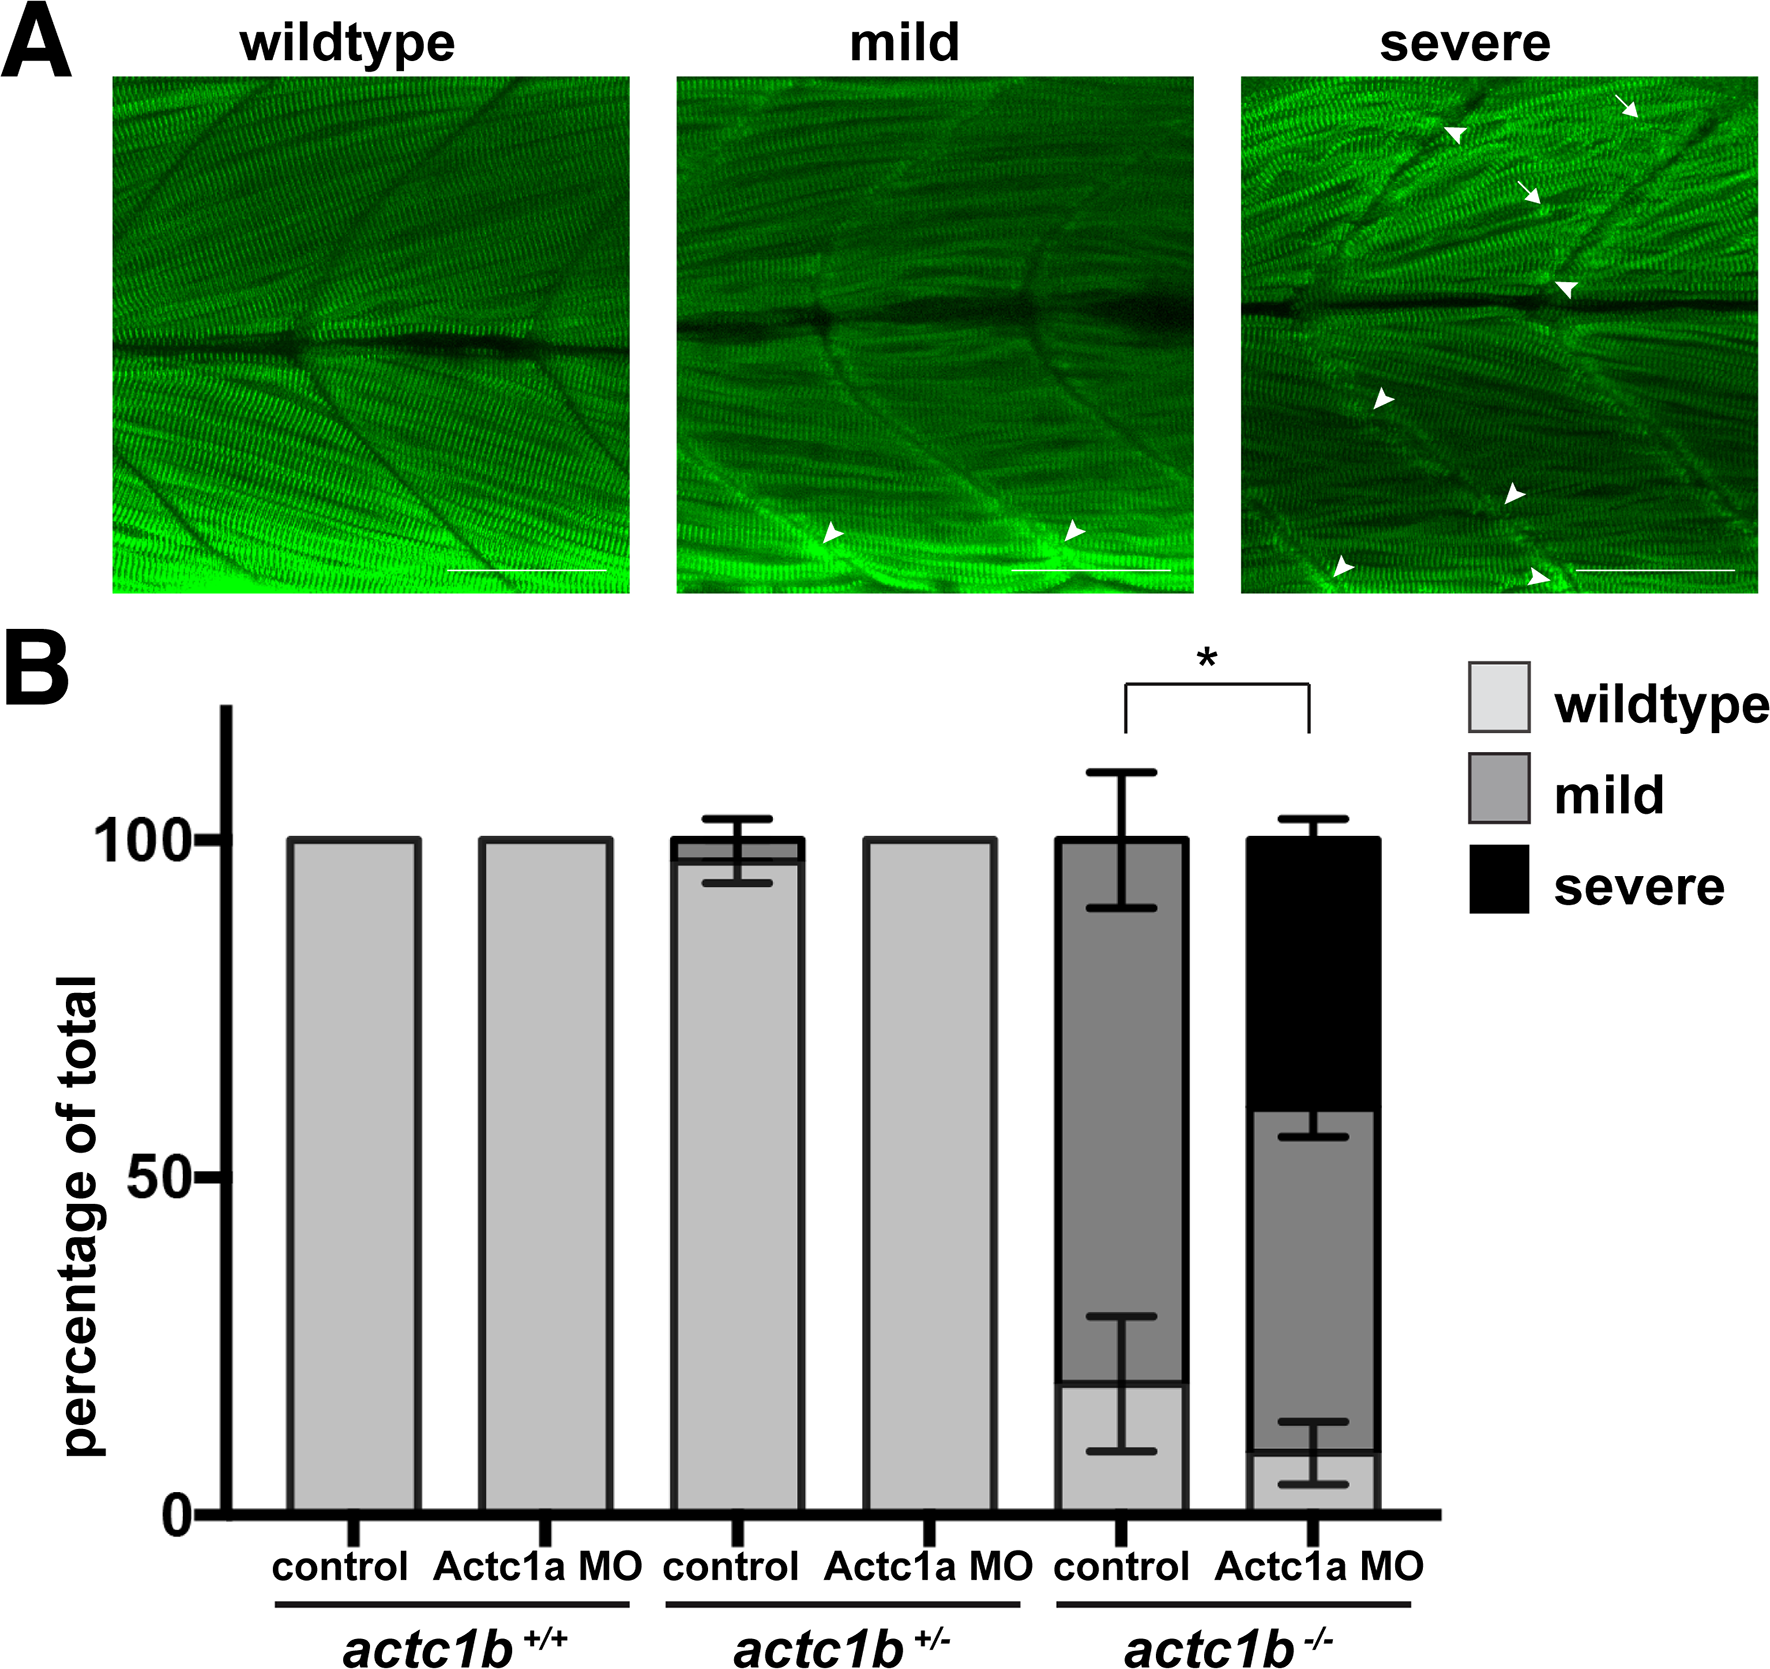
Fig. 5
Characterization of phenotypic severity following Actc1a morpholino knockdown.
A) actc1b-/- and wildtype siblings (actc1b+/- and actc1b+/+) injected with either an Actc1a splice or Standard Control MO were stained with Actinin2 and phenotypes were scored as either wildtype, mild (small outgrowth of aggregates at the myosepta (arrowheads)) or severe (large outgrowth of aggregates at the myosepta (arrowheads) and Actinin2 positive aggregates throughout the muscle fibers (arrows)). Scale bar represents 50μm. B) Quantification of the phenotypic severity for actc1b-/- and wildtype siblings (actc1b+/+ and actc1b+/-) injected with Actc1a splice compared to Standard Control MO injected zebrafish. Error bars represent SEM for three independent experiments (for Actc1a MO n = 8,13,7 actc1b+/+, n = 27,16,16 actc1b+/- and n = 7,15,7 actc1b+/+ and for Standard Control MO n = 7,3,7 actc1b+/+, n = 16,21,20 actc1b+/- and n = 4,8,6 actc1b-/-), *p<0.05 indicates a significant difference in phenotype proportions using a Chi-square test.