
- Title
-
Neuropeptide Y Regulates Sleep by Modulating Noradrenergic Signaling
- Authors
- Singh, C., Rihel, J., Prober, D.A.
- Source
- Full text @ Curr. Biol.
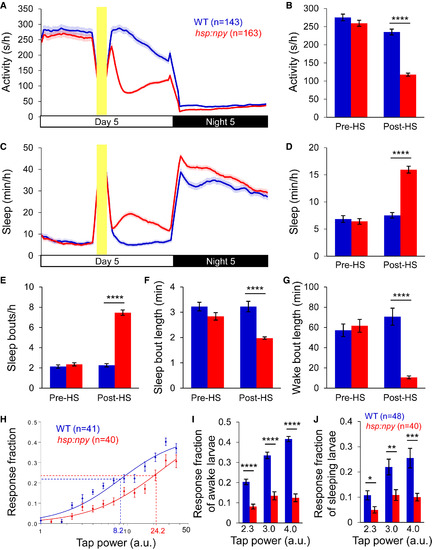
Overexpression of Zebrafish NPY Increases Sleep and Arousal Threshold (A–G) Overexpression of zebrafish NPY following a heat shock at 3 p.m. resulted in decreased locomotor activity (A and B) and increased sleep (C and D), due to more sleep bouts (E) and shorter sleep (F) and wake (G) bouts. Yellow bars indicate heat shock (HS). Pre-HS and post-HS quantify data for day 5 before and after HS. Mean ± SEM from four experiments is shown. (H) Representative stimulus-response curve for Tg(hsp:npy) animals compared to WT siblings following HS. Data points represent mean ± SEM. Dashed lines mark ETP50 value for each genotype. Tg(hsp:npy) animals had an ETP50 value of 24.2 versus 8.2 for WT siblings (293% increase, p < 0.05 by extra sum-of-squares F test). (I and J) Overexpression of NPY reduced the response of Tg(hsp:npy) animals to the stimulus compared to WT siblings during both awake (I) and sleep (J) states. Stimulus intensities of 2.3, 3.0, and 4.0 arbitrary units (a.u.) were tested. A dose-dependent response was observed for WT animals, but not their Tg(hsp:npy) siblings. Bar graphs show mean ± SEM. n, number of animals. ∗p < 0.05; ∗∗p < 0.01; ∗∗∗p < 0.001; ∗∗∗∗p < 0.0001 by two-tailed Student’s t test. See also Figures S1 and S2 and Movie S1. PHENOTYPE:
|
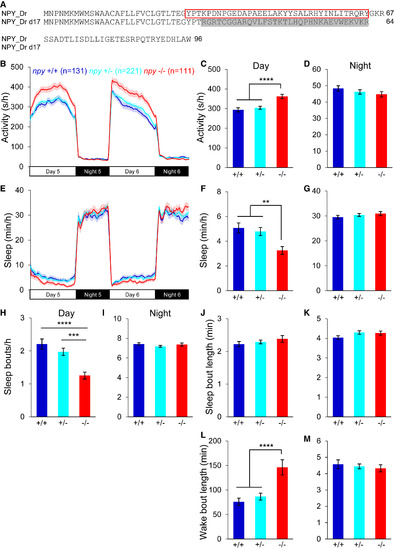
Loss of npy Reduces Daytime Sleep (A) Sequences of WT and mutant zebrafish NPY proteins. The mature peptide is indicated with a red box. Altered amino acids in the mutant are shaded gray. (B–M) npy−/− animals were more active (B and C), and slept less (E and F), than their npy+/+ and npy+/− siblings during the day, due to fewer sleep bouts (H) and longer wake bouts (L). There was no difference in activity (B and D), sleep (E and G), sleep bout number (I) or wake bout length (M) at night, or in sleep bout length during the day (J) or night (K). Mean ± SEM from seven experiments is shown. n, number of animals. ∗∗p < 0.01; ∗∗∗p < 0.001; ∗∗∗∗p < 0.0001 by one-way ANOVA with Holm-Sidak test. PHENOTYPE:
|
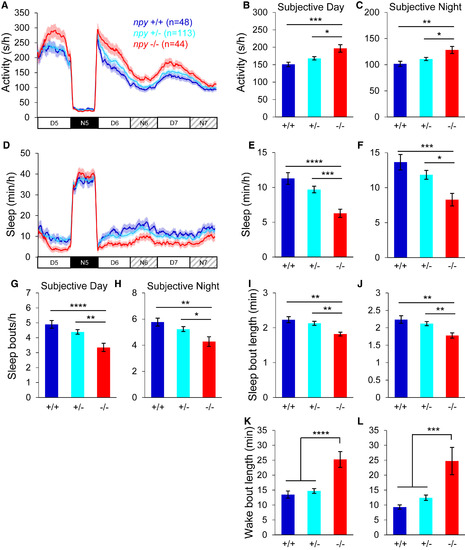
Entrained npy Mutants Sleep Less in Constant Light Larvae were entrained in 14:10-hr LD cycles for the first 4 days and nights of development, and then behaviorally monitored for 24 hr in LD and then for 48 hr in LL. npy−/− animals were more active (A–C) and slept less (D–F) than their npy+/− and npy+/+ siblings during subjective day and night, due to fewer (G and H) and shorter (I and J) sleep bouts and longer wake bouts (K and L). Mean ± SEM from three experiments is shown. n, number of animals. ∗p < 0.05; ∗∗p < 0.01; ∗∗∗p < 0.001; ∗∗∗∗p < 0.0001 by one-way ANOVA with Holm-Sidak test. See also Figure S3. PHENOTYPE:
|
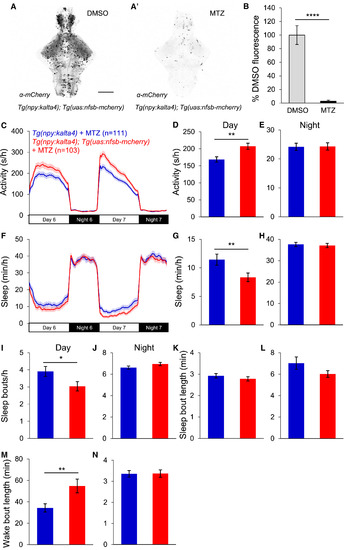
Loss of npy-Expressing Neurons Reduces Daytime Sleep (A and A′) Ventral views of brains from 5-dpf Tg(npy:kalta4);Tg(uas:nfsb-mcherry) animals stained with anti-DsRed antibody following treatment with DMSO (A) or 10 mM MTZ (A′), showing nearly complete loss of mCherry after MTZ treatment. Scale bar, 100 μm. (B) Mean ± SEM mCherry fluorescence intensity for Tg(npy:kalta4);Tg(uas:nfsb-mcherry) animals treated with DMSO (n = 4) or MTZ (n = 4). (C–N) Tg(npy:kalta4);Tg(uas:nfsb-mcherry) animals treated with MTZ were more active (C and D) and slept less (F and G) than identically treated Tg(npy:kalta4) siblings during the day, due to fewer sleep bouts (I) and longer wake bouts (M). There was no difference in activity (C and E), sleep (F and H), sleep bout number (J) or wake bout length (N) at night, or in sleep bout length during the day (K) or night (L). Mean ± SEM from three experiments is shown. n, number of animals. ∗p < 0.05; ∗∗p < 0.01; ∗∗∗∗p < 0.0001 by two-tailed Student’s t test. See also Figures S4 and S5 and Table S1. |
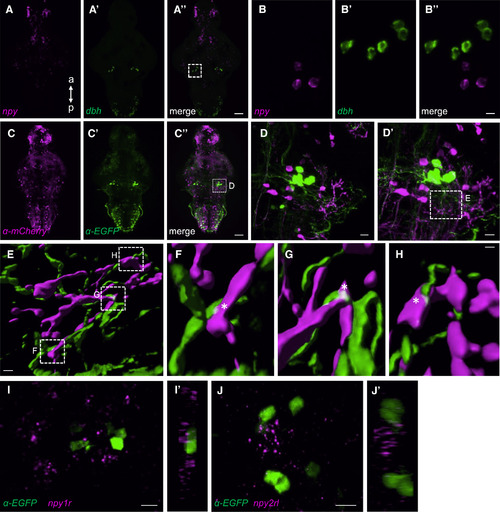
Evidence for Anatomical Interaction between Hindbrain NPY Neurons and the LC (A–B″) Double FISH using probes specific for npy (A) and dbh (A′) show their close proximity in the LC (A″). Boxed region in (A″) is magnified in a 50-μm-thick maximum-intensity projection in (B–B″). (C–D′) Tg(npy:kalta4);Tg(uas:nfsb-mcherry);Tg(dbh:EGFP) brains labeled using anti-DsRed (C) and anti-EGFP antibodies (C′). Boxed region in (C″) is magnified 25× in (D) and 63× in (D′). Maximum-intensity projections 40 and 63 μm thick are shown in (D) and (D′). (E) Surface rendering of the boxed region in (D′). (F–H) Magnification of the boxed regions in (E). White asterisks show the close proximity of NPY and LC neuron projections. (I and J) FISH using npy1r- and npy2rl-specific probes and immunostaining using an anti-EGFP antibody in Tg(dbh:EGFP) brains reveal the close proximity of npy1r (I) and npy2rl (J) to dbh-expressing LC neurons. (I′) and (J′) show orthogonal views of the 24- and 25-μm-thick maximum-intensity projections shown in (I) and (J). a, anterior; p, posterior. Samples are 5-dpf brains. Scale bars, (A″ and C″) 50 μm, (B″ and D) 10 μm, (D′) 7.5 μm, (E) 2.0 μm, (F–H) 0.5 μm, and (I–J) 10 μm. See also Movie S2. EXPRESSION / LABELING:
|
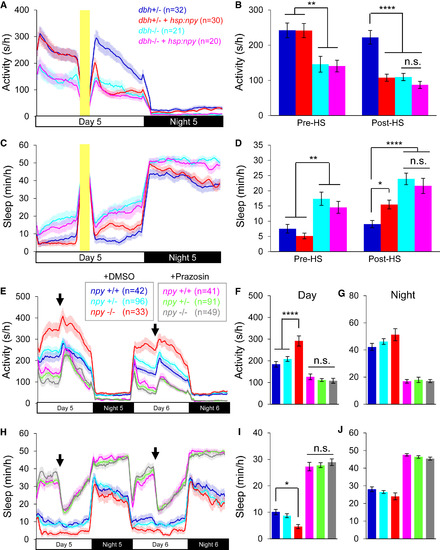
Functional Evidence that NPY Promotes Sleep by Inhibiting NE Signaling (A–D) Tg(hsp:npy);dbh−/− and dbh−/− animals were less active (A and B) and slept more (C and D) than dbh+/− siblings during the day before and after HS. Tg(hsp:npy);dbh+/− animals were less active and slept more than dbh+/− siblings during the day after HS. NPY overexpression in Tg(hsp:npy);dbh−/− animals did not further decrease locomotor activity or increase sleep compared to dbh−/− siblings. Yellow bars indicate HS. Pre-HS and post-HS quantify data on day 5 before and after HS. (E–J) npy+/+, npy+/−, and npy−/− siblings were treated with either DMSO or prazosin. DMSO-treated npy−/− animals were more active (E and F) and slept less (H and I) than their DMSO-treated npy+/− and npy+/+ siblings during the day, but there was no difference at night (E, G, H and J). Prazosin decreased activity (E and F) and increased sleep (H and I) to a similar extent for npy−/−, npy+/−, and npy+/+ siblings during the day. Arrows indicate behavioral artifacts due to addition of water. Mean ± SEM for 2 (A–D) or 4 (E–J) experiments is shown. n.s., not significant; ∗p < 0.05; ∗∗p < 0.01; ∗∗∗∗p < 0.0001 by two-way ANOVA with Holm-Sidak test. See also Figures S6 and S7 and Table S2. PHENOTYPE:
|
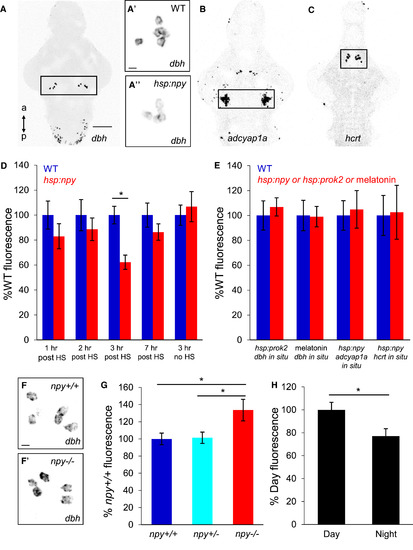
NPY Signaling Affects dbh mRNA Level in the LC (A–C) ISH showing dbh expression in the LC (A, boxed) and medulla oblongata. dbh mRNA levels were lower in Tg(hsp:npy) animals (A″) compared to WT siblings (A′) after HS. ISH using probes specific for adcyap1a (B) and hcrt (C). Boxed regions in (A)–(C) are quantified in (D) and (E). (D) dbh mRNA level in the LC is lower in Tg(hsp:npy) animals than WT siblings at 3 hr post-HS, but there is no significant difference at 1, 2, or 7 hr post-HS. (E) Overexpression of Prok2 or treatment with 20 μM melatonin had no effect on dbh expression. NPY overexpression did not affect adcyap1a or hcrt expression. (F and F′) dbh mRNA level in the LC was higher in npy−/− animals (F′) compared to npy+/+ siblings (F). (G) Quantification of dbh mRNA level in the LC of npy−/− animals and sibling controls. (H) dbh mRNA level in the LC of WT animals was lower at night than during the day. Mean ± SEM fluorescence intensity from 8–12 brains for each condition is shown. ∗p < 0.05 by two-tailed Student’s t test (D and H) or one-way ANOVA with Holm-Sidak test (G). Samples are 5-dpf brains. Scale bars, (A–C) 100 μm and (A′, A″, F, and F′) 10 μm. |

A genetic screen identifies a sleep-promoting role for NPY and zebrafish npy is widely expressed in the brain. Related to Figure 1. (A) Histogram depicting the total amount of sleep during the night after heat shock for ~1200 human genes tested in the larval zebrafish genetic screen. Larvae overexpressing human NPY had a Z-score of 1.8. Overexpression of human NPY decreased locomotor activity (B-D) and increased sleep (E-G) compared to EGFPoverexpressing controls during the night following heat shock (indicated by yellow bar). (H) Amino acid sequence alignment of human (Hs), mouse (Mm) and zebrafish (Dr) NPY mature peptide sequences. Colors indicate residues with similar properties. (I-L) ISH using an npyspecific probe reveals discrete yet widespread nuclei of npy expression in a 6-dpf zebrafish. Images show 4 different focal planes, with the most dorsal image at left. The full image stack of npy expression throughout the brain mapped onto the Z-brain atlas is shown in Movie S1. (M,N) Schematic drawings illustrate relative positions of different npy-expressing populations in ventral (M) and lateral (N) views. npy is expressed in the olfactory bulb (a), telencephalon (b), preoptic area (c), posterior tuberculum (d), Intermediate lateral hypothalamus (e), caudal medial hypothalamus (f), pretectum (g), torus semicircularis (h), tectum (i), locus coeruleus (j), medial rhombomere (k) and subpallium (l). a, anterior; p, posterior; d, dorsal; v, ventral. Scale bar: 100 μm. Mean (B,E) and mean ± SEM (C,D,F,G) are shown. n=number of animals. *P<0.05, **P<0.01 by two-tailed Student’s t test. |
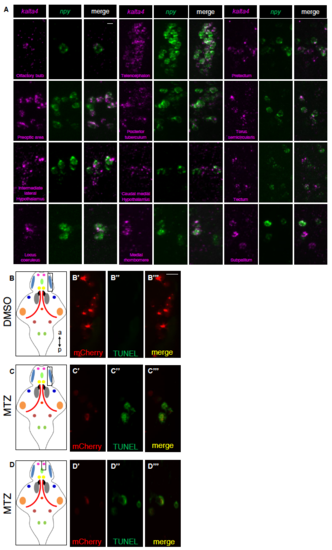
Specific expression of kalta4 in npy-expressing neurons and TUNEL labeling of apoptotic cells. Related to Figure 4. (A) Double FISH showing kalta4 and npy co-expression using probes specific for kalta4 and npy in different populations of npy-expressing neurons. (B-D) Tg(npy:kalta4);Tg(uas:nfsb-mcherry) animals were treated with DMSO (B) or 10 mM MTZ (C,D) from 72-90 hpf, and then fixed and processed for TUNEL. TUNEL labeling was observed in npyexpressing neurons of animals treated with MTZ (C,D), but not in animals treated with DMSO (B). Note that mCherry fluorescence is weaker in MTZ-treated animals because the neurons are undergoing apoptosis. Leftmost panels show schematic brain diagrams with npy expression domains colored as in Figure S1, and boxes indicate exemplar regions shown in the fluorescent images. a, anterior; p, posterior. Scale bar: 10 μm. |