
Fig. 4
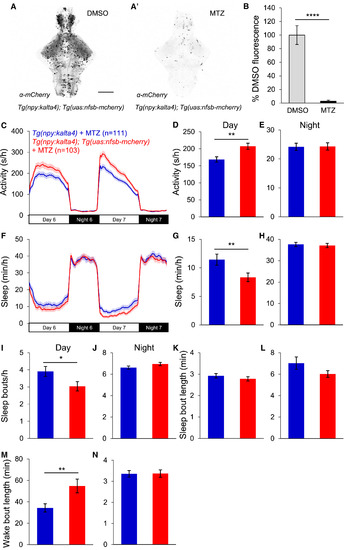
Loss of npy-Expressing Neurons Reduces Daytime Sleep (A and A′) Ventral views of brains from 5-dpf Tg(npy:kalta4);Tg(uas:nfsb-mcherry) animals stained with anti-DsRed antibody following treatment with DMSO (A) or 10 mM MTZ (A′), showing nearly complete loss of mCherry after MTZ treatment. Scale bar, 100 μm. (B) Mean ± SEM mCherry fluorescence intensity for Tg(npy:kalta4);Tg(uas:nfsb-mcherry) animals treated with DMSO (n = 4) or MTZ (n = 4). (C–N) Tg(npy:kalta4);Tg(uas:nfsb-mcherry) animals treated with MTZ were more active (C and D) and slept less (F and G) than identically treated Tg(npy:kalta4) siblings during the day, due to fewer sleep bouts (I) and longer wake bouts (M). There was no difference in activity (C and E), sleep (F and H), sleep bout number (J) or wake bout length (N) at night, or in sleep bout length during the day (K) or night (L). Mean ± SEM from three experiments is shown. n, number of animals. ∗p < 0.05; ∗∗p < 0.01; ∗∗∗∗p < 0.0001 by two-tailed Student’s t test. See also Figures S4 and S5 and Table S1. |
| Gene: | |
|---|---|
| Fish: | |
| Condition: | |
| Anatomical Term: | |
| Stage: | Day 5 |
| Fish: | |
|---|---|
| Condition: | |
| Observed In: | |
| Stage: | Day 5 |