
Fig. 5
|
Fig. 5
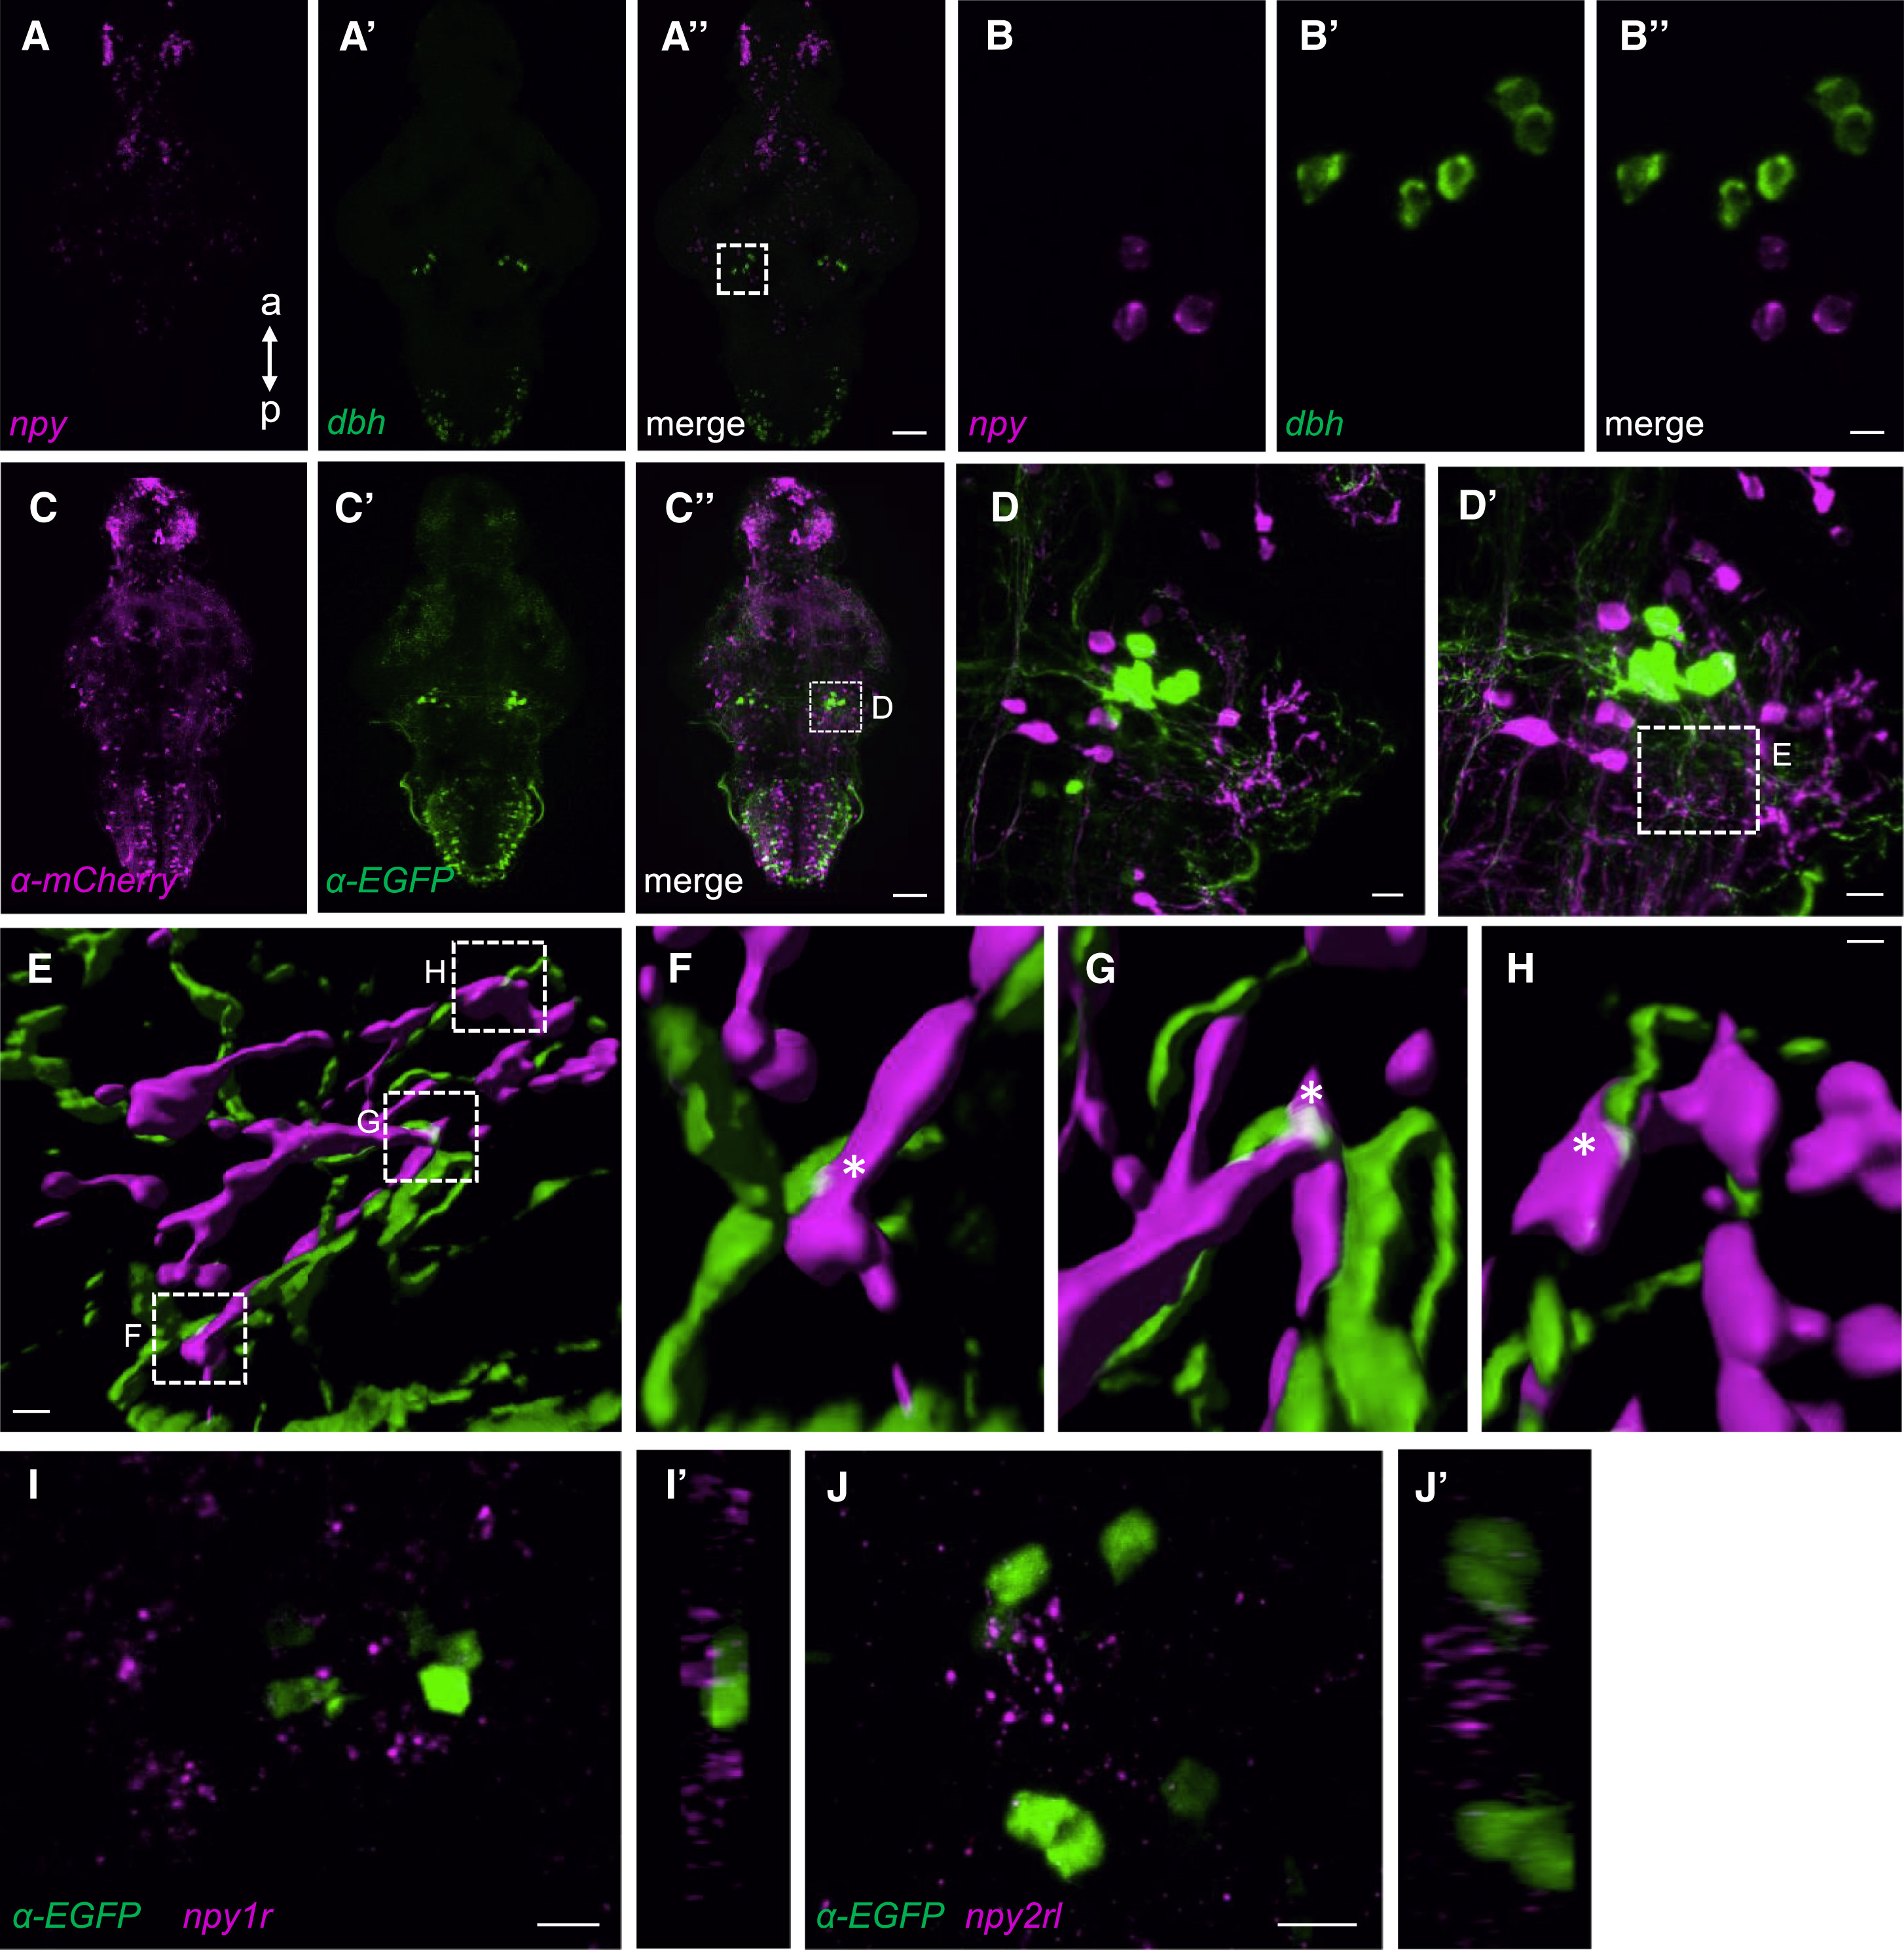
Evidence for Anatomical Interaction between Hindbrain NPY Neurons and the LC
(A–B″) Double FISH using probes specific for npy (A) and dbh (A′) show their close proximity in the LC (A″). Boxed region in (A″) is magnified in a 50-μm-thick maximum-intensity projection in (B–B″).
(C–D′) Tg(npy:kalta4);Tg(uas:nfsb-mcherry);Tg(dbh:EGFP) brains labeled using anti-DsRed (C) and anti-EGFP antibodies (C′). Boxed region in (C″) is magnified 25× in (D) and 63× in (D′). Maximum-intensity projections 40 and 63 μm thick are shown in (D) and (D′).
(E) Surface rendering of the boxed region in (D′).
(F–H) Magnification of the boxed regions in (E). White asterisks show the close proximity of NPY and LC neuron projections.
(I and J) FISH using npy1r- and npy2rl-specific probes and immunostaining using an anti-EGFP antibody in Tg(dbh:EGFP) brains reveal the close proximity of npy1r (I) and npy2rl (J) to dbh-expressing LC neurons. (I′) and (J′) show orthogonal views of the 24- and 25-μm-thick maximum-intensity projections shown in (I) and (J).
a, anterior; p, posterior. Samples are 5-dpf brains. Scale bars, (A″ and C″) 50 μm, (B″ and D) 10 μm, (D′) 7.5 μm, (E) 2.0 μm, (F–H) 0.5 μm, and (I–J) 10 μm.
See also Movie S2.