
|
Fig. S5
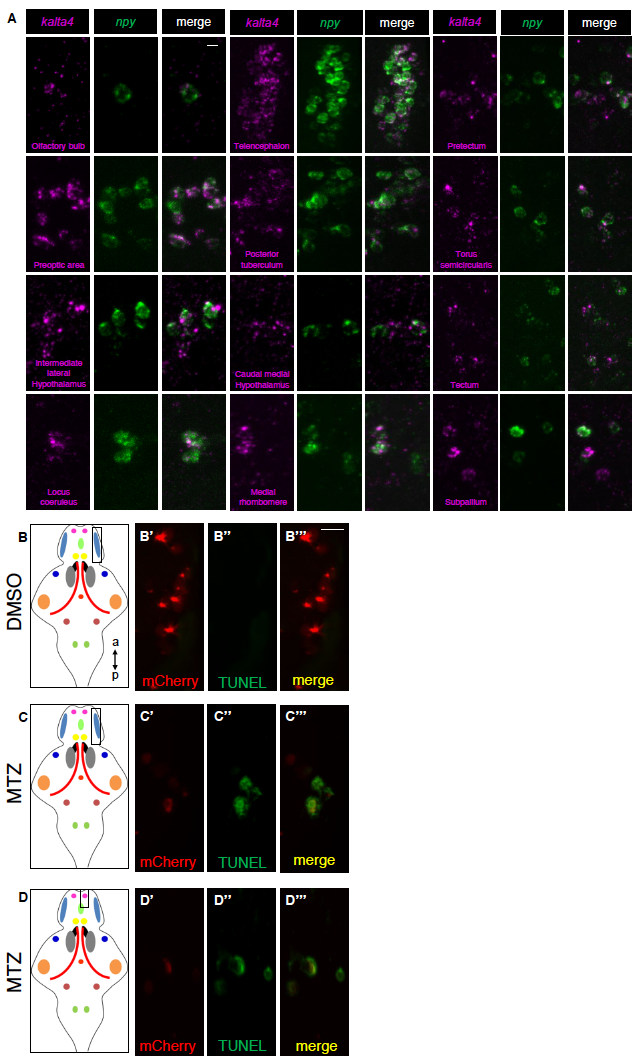
Specific expression of kalta4 in npy-expressing neurons and TUNEL labeling of apoptotic cells. Related to Figure 4. (A) Double FISH showing kalta4 and npy co-expression using probes specific for kalta4 and npy in different populations of npy-expressing neurons. (B-D) Tg(npy:kalta4);Tg(uas:nfsb-mcherry) animals were treated with DMSO (B) or 10 mM MTZ (C,D) from 72-90 hpf, and then fixed and processed for TUNEL. TUNEL labeling was observed in npyexpressing neurons of animals treated with MTZ (C,D), but not in animals treated with DMSO (B). Note that mCherry fluorescence is weaker in MTZ-treated animals because the neurons are undergoing apoptosis. Leftmost panels show schematic brain diagrams with npy expression domains colored as in Figure S1, and boxes indicate exemplar regions shown in the fluorescent images. a, anterior; p, posterior. Scale bar: 10 μm.