
|
Fig. S1
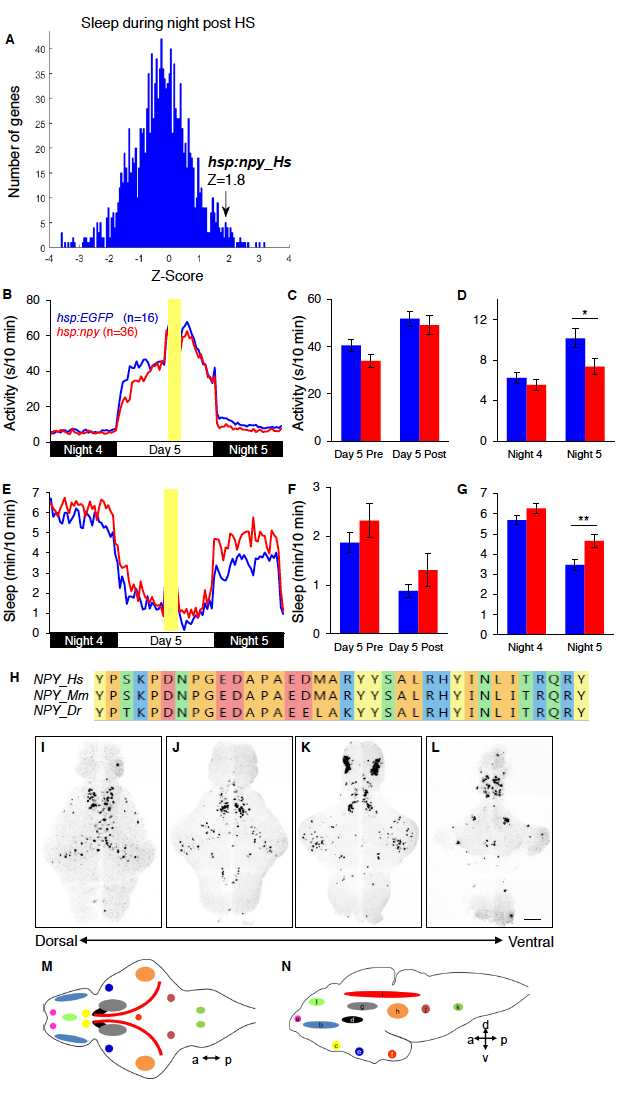
A genetic screen identifies a sleep-promoting role for NPY and zebrafish npy is widely expressed in the brain. Related to Figure 1. (A) Histogram depicting the total amount of sleep during the night after heat shock for ~1200 human genes tested in the larval zebrafish genetic screen. Larvae overexpressing human NPY had a Z-score of 1.8. Overexpression of human NPY decreased locomotor activity (B-D) and increased sleep (E-G) compared to EGFPoverexpressing controls during the night following heat shock (indicated by yellow bar). (H) Amino acid sequence alignment of human (Hs), mouse (Mm) and zebrafish (Dr) NPY mature peptide sequences. Colors indicate residues with similar properties. (I-L) ISH using an npyspecific probe reveals discrete yet widespread nuclei of npy expression in a 6-dpf zebrafish. Images show 4 different focal planes, with the most dorsal image at left. The full image stack of npy expression throughout the brain mapped onto the Z-brain atlas is shown in Movie S1. (M,N) Schematic drawings illustrate relative positions of different npy-expressing populations in ventral (M) and lateral (N) views. npy is expressed in the olfactory bulb (a), telencephalon (b), preoptic area (c), posterior tuberculum (d), Intermediate lateral hypothalamus (e), caudal medial hypothalamus (f), pretectum (g), torus semicircularis (h), tectum (i), locus coeruleus (j), medial rhombomere (k) and subpallium (l). a, anterior; p, posterior; d, dorsal; v, ventral. Scale bar: 100 μm. Mean (B,E) and mean ± SEM (C,D,F,G) are shown. n=number of animals. *P<0.05, **P<0.01 by two-tailed Student’s t test.