
- Title
-
Foxj1a is expressed in ependymal precursors, controls central canal position and is activated in new ependymal cells during regeneration in zebrafish
- Authors
- Ribeiro, A., Monteiro, J.F., Certal, A.C., Cristovão, A.M., Saúde, L.
- Source
- Full text @ Open Biol.
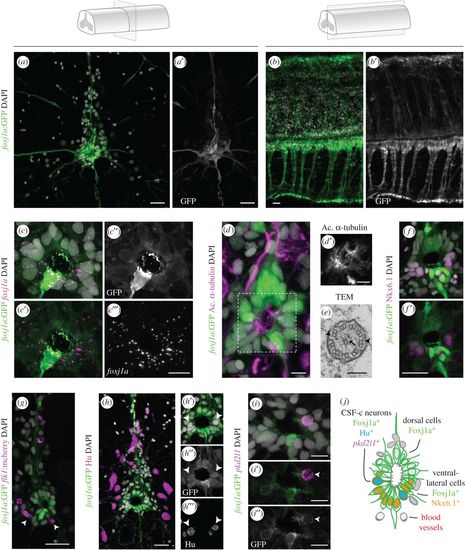
Foxj1a is expressed in ependymal cells in the zebrafish adult spinal cord. (a–b′) Confocal stack projection of a spinal cord transverse section (a,a′) and sagittal section (b,b′) in adult Tg(0.6foxj1a:GFP) transgenic zebrafish. (c–c‴) FISH of foxj1a (magenta) in a transverse section of a spinal cord expressing the foxj1a:GFP reporter (green), showing a similar pattern of expression. (d,d′) Immunostaining with acetylated α-tubulin (magenta) to label cilia present on the apical surface of Foxj1a-expressing cells (green). (e) TEM image of a cilium at the apical ependymal region, with a central pair of microtubules (arrow) and outer dynein arms (arrowheads). (f,f′) Ventral foxj1a:GFP+ cells express the progenitor marker Nkx6.1 (magenta). (g) BVs (mCherry+ endothelial cells in magenta) are present in the proximity of GFP+ ERGs (arrowheads). (h) Pan-neuronal marker HuC/D (Hu, magenta) immunostaining and foxj1a:GFP expression in a spinal cord transverse section. (h′–h‴) Magnification of the central canal highlighting Hu/Foxj1a double positive cells (arrowheads). (i–i″) FISH of pkd2l1 (magenta) showing co-expression with foxj1a:GFP (arrowheads) in the ependymal region. (j) Scheme of the spinal cord ependymal region showing subtypes of Foxj1a-expressing cells, based on molecular expression and cell morphology. The term ependymal cells is not consensual, as other authors suggest that adult zebrafish spinal cords only contain ERGs. DAPI-labelled nuclei are shown in grey. Scale bars: 20 µm in a,b,f–h; 10 µm in c‴; 5 µm in d; 100 nm in e; 10 µm in i. |
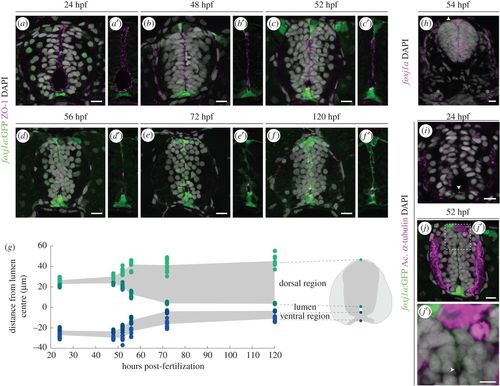
Foxj1a+ cells participate in the formation of the spinal cord central canal. (a–f′) Representative images of the neural tube region in transverse sections of Tg(0.6foxj1a:GFP) transgenic zebrafish embryos/larvae ranging from 24 to 120 hpf. The apical edge of the cells surrounding the lumen is identified by ZO-1 immunostaining (magenta) and the GFP reporter labels Foxj1a-expressing cells (green). (g) Quantification of lumen closure from 24 to 120 hpf. The positions of the floor plate, ventral and dorsal points of the lumen and roof plate are normalized to the middle point of the lumen. Sample number: 24 hpf (n = 12); 48 hpf (n = 6); 52 hpf (n = 9); 56 hpf (n = 9); 72 hpf (n = 11); 120 hpf (n = 8). (h) Confocal image of a FISH of foxj1a (magenta) in a 54 hpf embryo. foxj1a is expressed in the floor plate, ventro-lateral cells, roof plate (arrowhead) and pronephric (asterisks). (i,j,j′) Long cilia (arrowhead), labelled by acetylated α-tubulin (magenta), are present in Foxj1a-positive floor plate cells at 24 hpf (i) and in Foxj1a-expressing roof plate cells in the roof plate at 52 hpf (j,j′). DAPI-labelled nuclei are shown in grey. Scale bars: 10 µm in a–j; 5 µm in j′. |
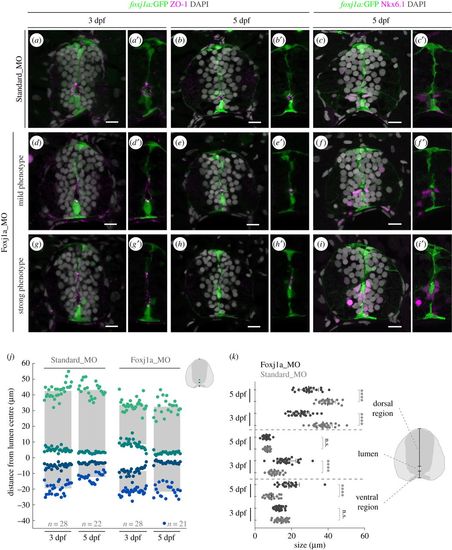
Neural tube lumen closure is perturbed in the absence of Foxj1a. (a–i′) Representative images of transverse sections of the neural tube of Tg(0.6foxj1a:GFP) transgenic larvae injected with Standard Morpholino (MO) (a–c′) or foxj1a MO (d–i′) at one-cell stage and analysed at 3 and 5 dpf. foxj1a MO-injected larvae showed lumen closure phenotypes with variable degrees of severity, between mild (d–f′) and strong (g–i′), as highlighted by the apical ZO-1 immunostaining (magenta) (a,b′,d,e′,g,h′). (c,c′,f,f′,i,i′) Nkx6.1+ cells (magenta) are still present lining the ventral half of the central canal in foxj1a morphants. DAPI-labelled nuclei are shown in grey. Scale bars: 10 µm. (j) Quantification of lumen closure in Standard MO and foxj1a MO larvae at 3 and 5 dpf. The positions are normalized to the middle point of the lumen. Sample number is shown in the graph and includes data from three independent experiments. (k) Quantification of the size of the lumen and the ventral and dorsal regions, derived from the data shown in (j). Each point represents one individual and the mean and s.d. bars are also shown. p values calculated using two-tailed unpaired t-test (****p < 0.0001; n.s., not significant). |
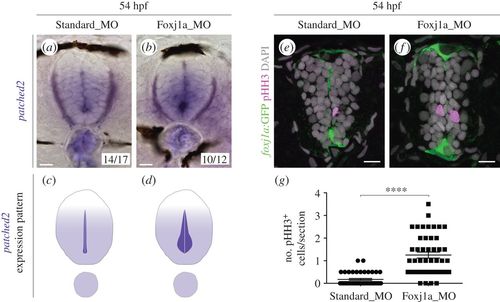
Shh signalling and proliferation are enhanced in the absence of Foxj1a. (a,b) Expression of patched2 by ISH in 54 hpf embryos injected with Standard Morpholino (MO) (a) or foxj1a MO (b). Two types of expression patterns were observed, which are schematically represented in (c,d). The majority of foxj1a morphants display increased patched2 expression in ventral cells surrounding the lumen. (e,f) Confocal images of transverse sections of Tg(0.6foxj1a:GFP) 54 hpf embryos injected with Standard MO (e) or foxj1a MO (f) and immunostained against phospho-histone H3 (pHH3) to detect mitotic cells (magenta). The foxj1a:GFP reporter is shown in green and DAPI-labelled nuclei are shown in grey. Scale bars, 10 µm. (g) Quantification of the number of pHH3+ cells per section (Standard MO, n = 43; foxj1a MO, n = 46). Data obtained from three independent experiments. Each point represents the average of two non-consecutive sections per embryo and the mean and s.d. bars are also shown. p value calculated using the two-tailed unpaired t-test (****p < 0.0001). |
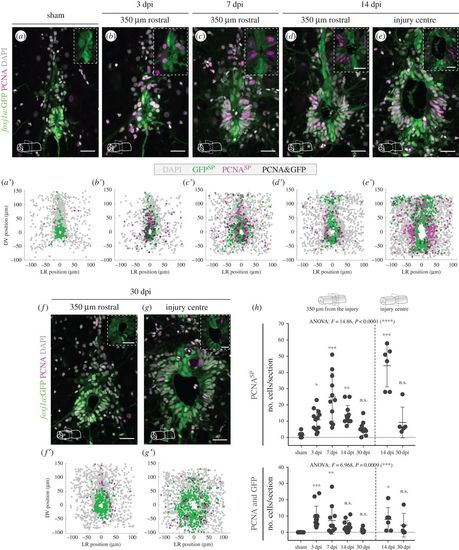
Spinal cord injury in adult zebrafish triggers proliferation of Foxj1a+ ERGs. (a–g) Representative confocal images of transverse sections of spinal cords of Tg(0.6foxj1a:GFP) transgenic zebrafish from 3 to 30 dpi. The control spinal cord in (a) was collected 7 days after a sham injury. The sections were located at 350 µm rostral to the injury centre (b–d,f) or at the injury site (e,g). Proliferative cells (in magenta) were labelled using an antibody against PCNA and cells expressing the GFP reporter are shown in green. DAPI-labelled nuclei are shown in grey. Scale bars, 20 µm. (a′–g′) Composite maps of cell positions quantified in transverse section images of different spinal cords for each time point (sham, 7 dpi, 14 dpi: n = 6; 3 dpi, 30 dpi: n = 5). DV, dorsal/ventral; LR, left/right; SP, single positive. (h) Quantification of the number of PCNASP (top plot) and PCNA+/GFP+ (bottom plot) cells per section. Each circle represents one section at 350 µm rostral or caudal from the injury centre (left side of plot) or at the injury site (right side of plot). The mean and s.d. bars are also shown and a one-way ANOVA F-test was performed between groups, followed by a Dunnett test to compare every mean to the control mean (*p < 0.05; **p < 0.01; ***p < 0.001; n.s., non-significant). |
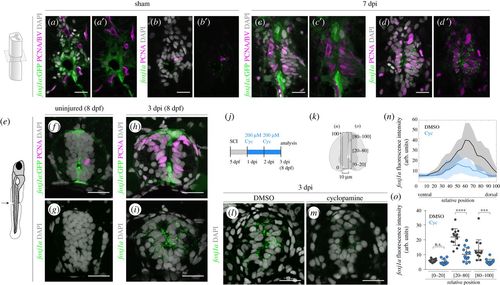
Endogenous Foxj1a expression is increased in response to injury in a Shh-dependent manner. (a–d′) Confocal images of transverse sections of Tg(0.6foxj1a:GFP) spinal cords immunostained against GFP (a,c) and FISH for foxj1a transcripts (b,d) in adjacent sections of sham-injury spinal cord (a,b) (n = 2) and 7 dpi spinal cord (c,d) (n = 8). The co-labelling with an antibody against PCNA (in magenta) shows that the majority of proliferative ERGs express foxj1a (d,d′) but not the foxj1a:GFP transgene (c,c′). BVs are also visible in (a) and (c) due to the expression of the transgene Tg(flk1:mCherry). (e) Illustration of the site of spinal cord transection in 5 dpf larvae. (f–i) Representative confocal images of sections of 8 dpf Tg(0.6foxj1a:GFP) transgenic larvae, uninjured (f,g) (n = 8) or 3 dpi (h,i) (n = 10). Adjoining sections were either immunostained against GFP (green) and PCNA (magenta) (f,h) or processed with FISH for foxj1a transcripts (green) (g,i). (j) Schematic of the cyclopamine (Cyc) treatment experiments in injured larvae. (k) Schematic of the neural tube region selected to quantify the fluorescence levels of foxj1a transcripts plotted in (n) and (o). (l,m) Representative confocal images of transverse sections of 3 dpi spinal cords of larvae treated for 2 days with DMSO (l) or 200 µM cyclopamine (m) in the medium. The sections were collected 100 µm rostral to the injury site and foxj1a transcripts were detected with FISH. (n) Fluorescence intensity (f.i.) profile of foxj1a transcripts along the dorsoventral axis (relative to the size of the neural tube) show reduced foxj1a levels in Cyc-treated larvae (blue) (DMSO: n = 14; Cyc: n = 13) (a.u., arbitrary units). The line represents the mean f.i. and shaded regions correspond to the standard deviation intervals. (o) Quantification of the average foxj1a f.i. in the regions shown in (k). The mean and s.d. bars are also shown in (n,o) and the p values were calculated using two-tailed unpaired t-test (n.s., not significant; ***p < 0.001; ****p < 0.0001). DAPI-labelled nuclei are shown in grey. Scale bars, 20 µm. |