
|
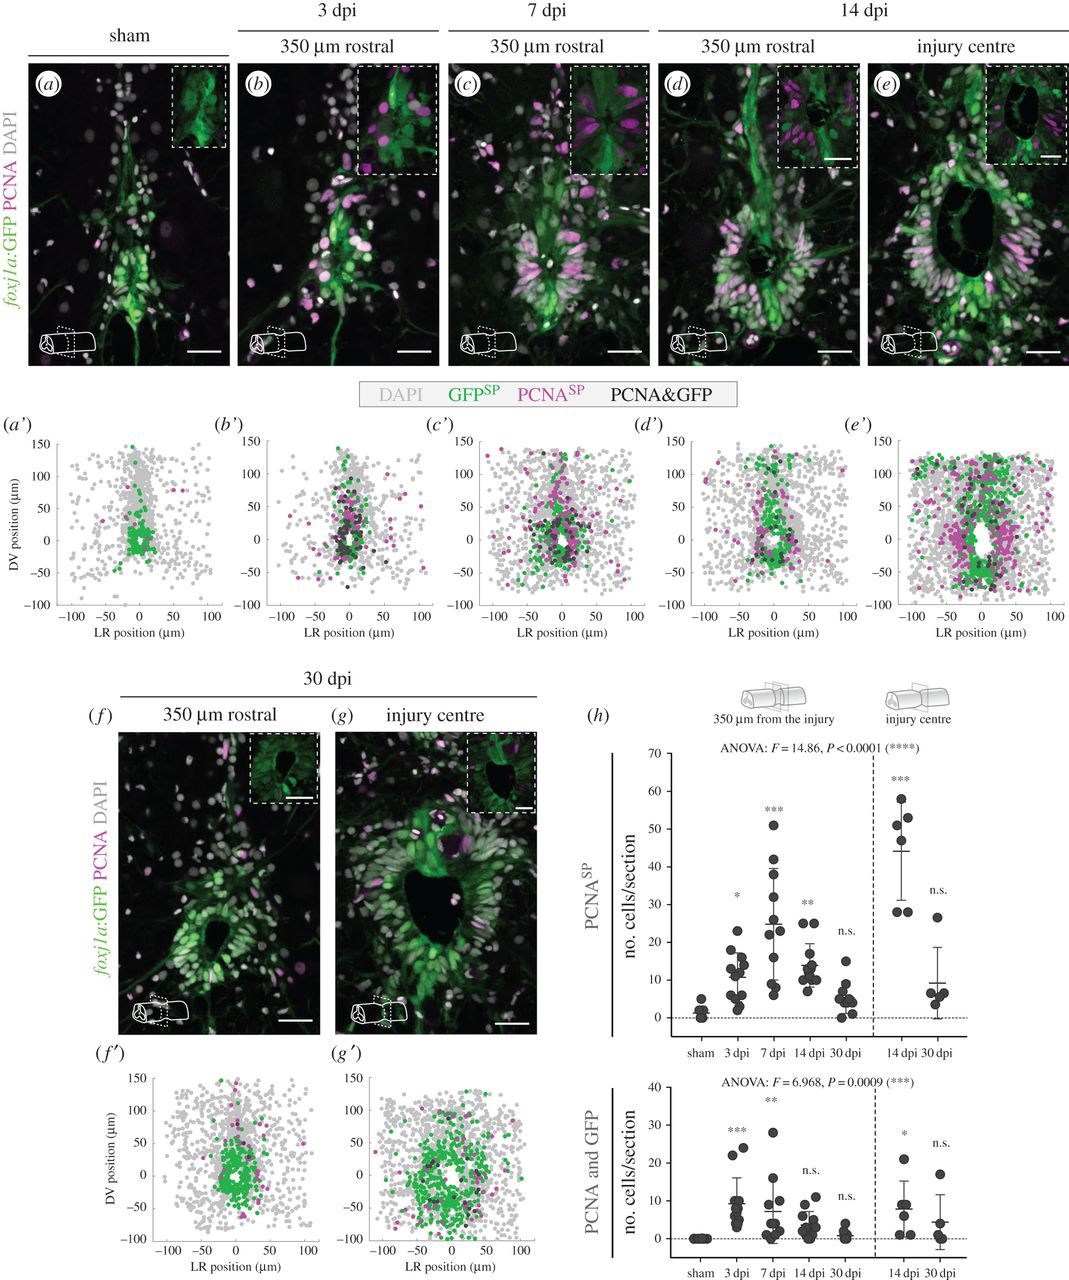
Fig. 5
Spinal cord injury in adult zebrafish triggers proliferation of Foxj1a+ ERGs. (a–g) Representative confocal images of transverse sections of spinal cords of Tg(0.6foxj1a:GFP) transgenic zebrafish from 3 to 30 dpi. The control spinal cord in (a) was collected 7 days after a sham injury. The sections were located at 350 µm rostral to the injury centre (b–d,f) or at the injury site (e,g). Proliferative cells (in magenta) were labelled using an antibody against PCNA and cells expressing the GFP reporter are shown in green. DAPI-labelled nuclei are shown in grey. Scale bars, 20 µm. (a′–g′) Composite maps of cell positions quantified in transverse section images of different spinal cords for each time point (sham, 7 dpi, 14 dpi: n = 6; 3 dpi, 30 dpi: n = 5). DV, dorsal/ventral; LR, left/right; SP, single positive. (h) Quantification of the number of PCNASP (top plot) and PCNA+/GFP+ (bottom plot) cells per section. Each circle represents one section at 350 µm rostral or caudal from the injury centre (left side of plot) or at the injury site (right side of plot). The mean and s.d. bars are also shown and a one-way ANOVA F-test was performed between groups, followed by a Dunnett test to compare every mean to the control mean (*p < 0.05; **p < 0.01; ***p < 0.001; n.s., non-significant).