
|
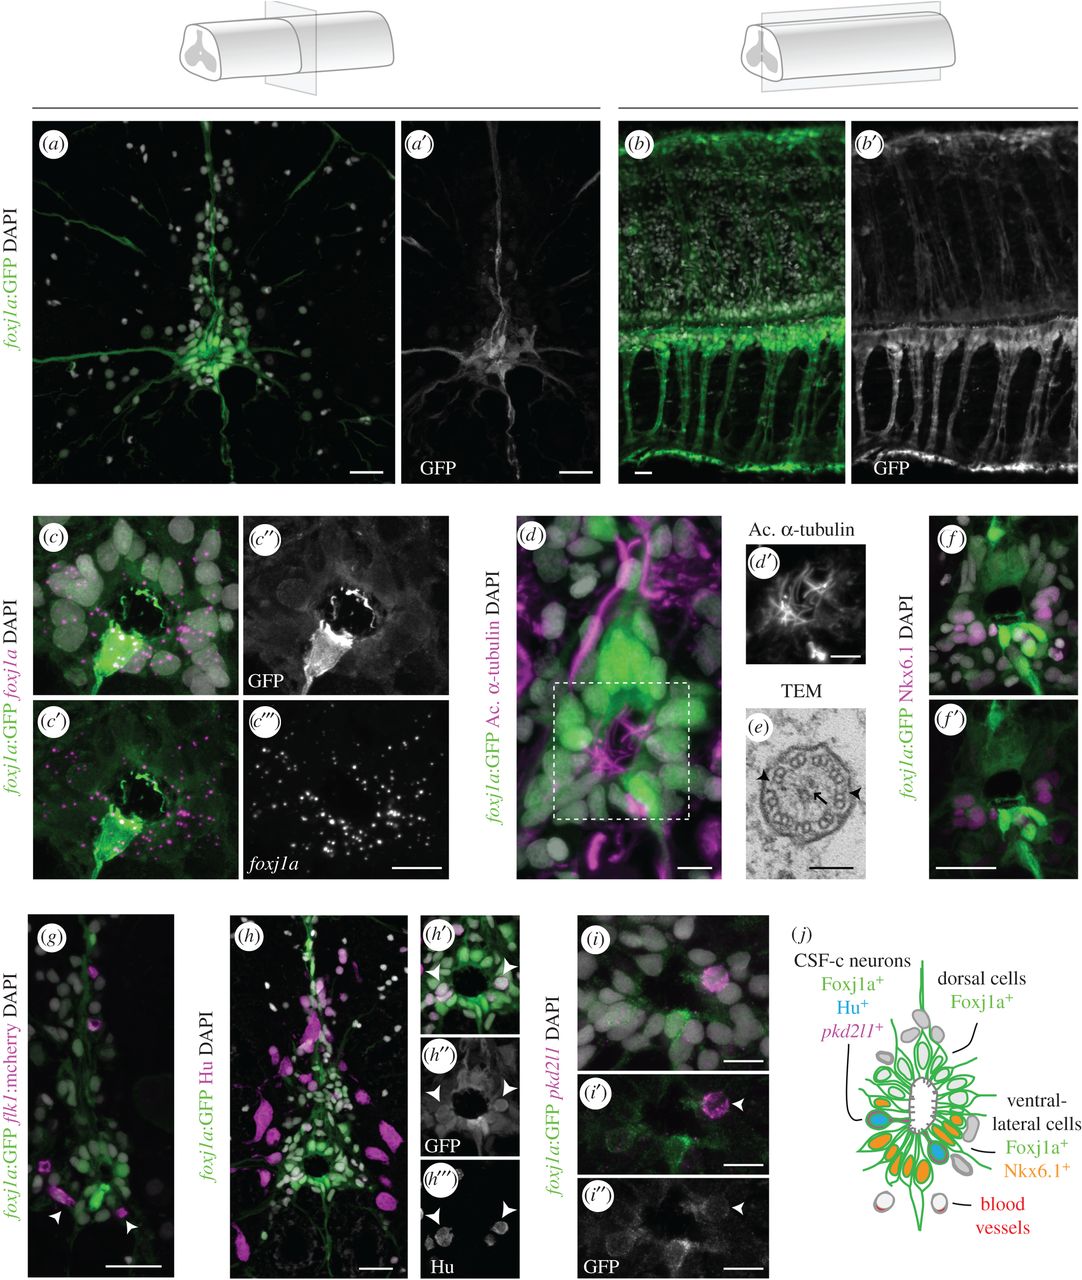
Fig. 1
Foxj1a is expressed in ependymal cells in the zebrafish adult spinal cord. (a–b′) Confocal stack projection of a spinal cord transverse section (a,a′) and sagittal section (b,b′) in adult Tg(0.6foxj1a:GFP) transgenic zebrafish. (c–c‴) FISH of foxj1a (magenta) in a transverse section of a spinal cord expressing the foxj1a:GFP reporter (green), showing a similar pattern of expression. (d,d′) Immunostaining with acetylated α-tubulin (magenta) to label cilia present on the apical surface of Foxj1a-expressing cells (green). (e) TEM image of a cilium at the apical ependymal region, with a central pair of microtubules (arrow) and outer dynein arms (arrowheads). (f,f′) Ventral foxj1a:GFP+ cells express the progenitor marker Nkx6.1 (magenta). (g) BVs (mCherry+ endothelial cells in magenta) are present in the proximity of GFP+ ERGs (arrowheads). (h) Pan-neuronal marker HuC/D (Hu, magenta) immunostaining and foxj1a:GFP expression in a spinal cord transverse section. (h′–h‴) Magnification of the central canal highlighting Hu/Foxj1a double positive cells (arrowheads). (i–i″) FISH of pkd2l1 (magenta) showing co-expression with foxj1a:GFP (arrowheads) in the ependymal region. (j) Scheme of the spinal cord ependymal region showing subtypes of Foxj1a-expressing cells, based on molecular expression and cell morphology. The term ependymal cells is not consensual, as other authors suggest that adult zebrafish spinal cords only contain ERGs. DAPI-labelled nuclei are shown in grey. Scale bars: 20 µm in a,b,f–h; 10 µm in c‴; 5 µm in d; 100 nm in e; 10 µm in i.