
|
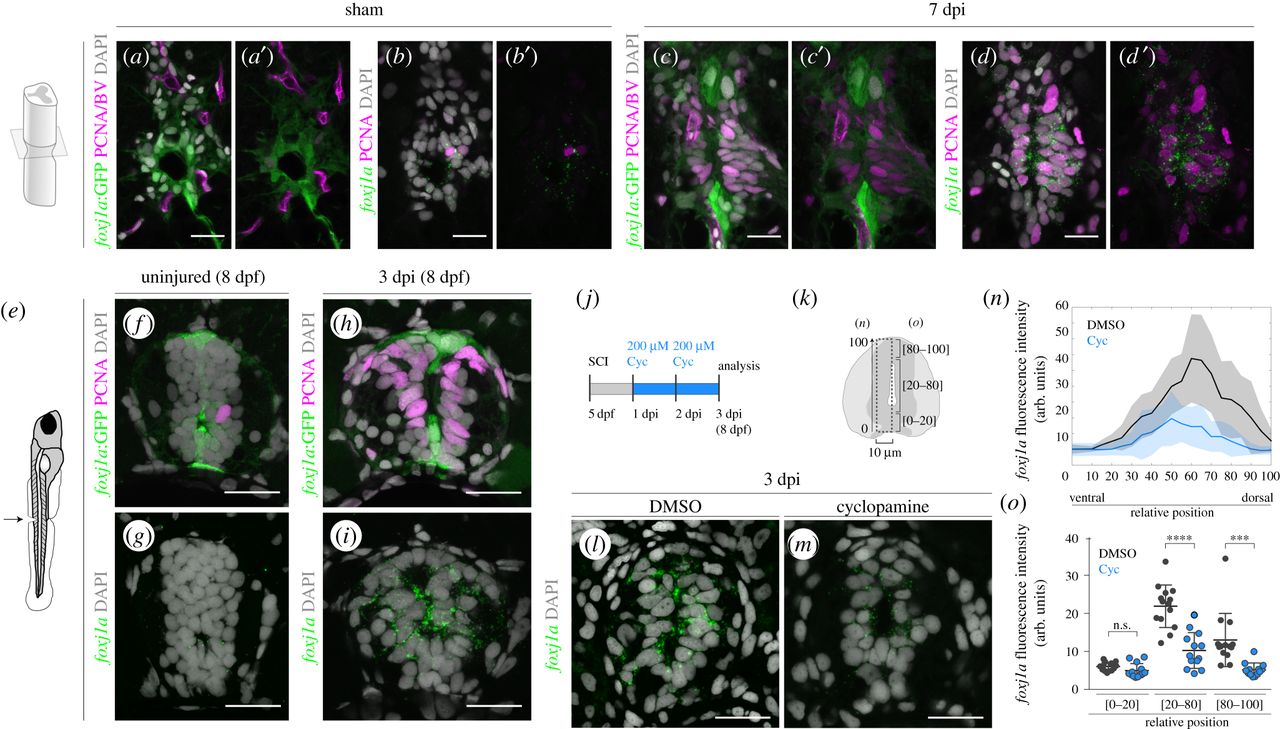
Fig. 6
Endogenous Foxj1a expression is increased in response to injury in a Shh-dependent manner. (a–d′) Confocal images of transverse sections of Tg(0.6foxj1a:GFP) spinal cords immunostained against GFP (a,c) and FISH for foxj1a transcripts (b,d) in adjacent sections of sham-injury spinal cord (a,b) (n = 2) and 7 dpi spinal cord (c,d) (n = 8). The co-labelling with an antibody against PCNA (in magenta) shows that the majority of proliferative ERGs express foxj1a (d,d′) but not the foxj1a:GFP transgene (c,c′). BVs are also visible in (a) and (c) due to the expression of the transgene Tg(flk1:mCherry). (e) Illustration of the site of spinal cord transection in 5 dpf larvae. (f–i) Representative confocal images of sections of 8 dpf Tg(0.6foxj1a:GFP) transgenic larvae, uninjured (f,g) (n = 8) or 3 dpi (h,i) (n = 10). Adjoining sections were either immunostained against GFP (green) and PCNA (magenta) (f,h) or processed with FISH for foxj1a transcripts (green) (g,i). (j) Schematic of the cyclopamine (Cyc) treatment experiments in injured larvae. (k) Schematic of the neural tube region selected to quantify the fluorescence levels of foxj1a transcripts plotted in (n) and (o). (l,m) Representative confocal images of transverse sections of 3 dpi spinal cords of larvae treated for 2 days with DMSO (l) or 200 µM cyclopamine (m) in the medium. The sections were collected 100 µm rostral to the injury site and foxj1a transcripts were detected with FISH. (n) Fluorescence intensity (f.i.) profile of foxj1a transcripts along the dorsoventral axis (relative to the size of the neural tube) show reduced foxj1a levels in Cyc-treated larvae (blue) (DMSO: n = 14; Cyc: n = 13) (a.u., arbitrary units). The line represents the mean f.i. and shaded regions correspond to the standard deviation intervals. (o) Quantification of the average foxj1a f.i. in the regions shown in (k). The mean and s.d. bars are also shown in (n,o) and the p values were calculated using two-tailed unpaired t-test (n.s., not significant; ***p < 0.001; ****p < 0.0001). DAPI-labelled nuclei are shown in grey. Scale bars, 20 µm.