
- Title
-
Cx43 suppresses evx1 expression to regulate joint initiation in the regenerating fin
- Authors
- Dardis, G., Tryon, R., Ton, Q., Johnson, S.L., Iovine, M.K.
- Source
- Full text @ Dev. Dyn.
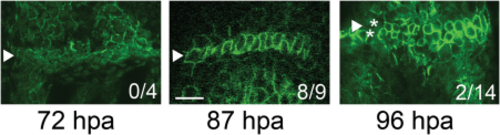
Establishment of the joint initiation time line. Fins were amputated at the 30% level and permitted to regenerate for 2–5 days before processing for ZNS5 immunofluorescence. Selected time points are shown. Fins at 87 hpa frequently exhibited “initiating” joints in the third fin ray from the dorsal or ventral side. The ratios in each image indicate the frequency of initiating joints at each time point. Arrowheads indicate the organizing joint-forming cells, and the asterisks in 96 hpa identify the separating rows of joint-forming cells. Scale bar = 20 µm. |
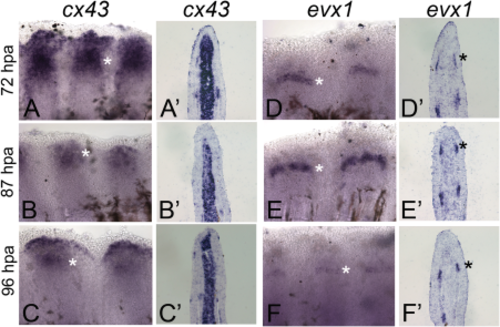
Expression of cx43 and evx1 during the joint initiation time line. Qualitative changes in cx43 and evx1 gene expression are shown. Whole-mount ISH for cx43 is shown at 72 hpf (A), 87 hpf (B), and 96 hpf (C). Cryo-ISH for cx43 is shown at 72 hpa (A'), 87 hpf (B'), and 96 hpf (C'). Whole-mount ISH for evx1 is shown at 72 hpf (D), 87 hpf (E), and 96 hpf (F). Cryo-ISH for evx1 is shown at 72 hpa (D'), 87 hpf (E'), and 96 hpf (F'). Asterisks identify regions of gene expression. Note that cx43 mRNA is detected medially in the dermal fibroblasts and laterally in a subset of cells in the osteoblast lineage, whereas evx1 mRNA is restricted to a subset of cells in the osteoblast lineage. |
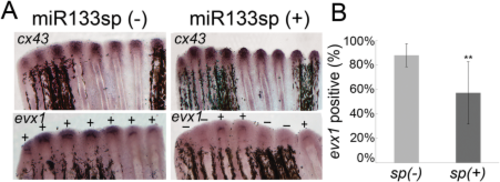
Increased cx43 at the time of joint formation reduces the frequency of evx1-positive rays. A: Whole-mount ISH shows increased cx43 and decreased evx1 expression at the time of joint initiation (87 hpa) in the Tg(hsp70:miR-133sp)pd48 line following a heat pulse at 72 hpa. Transgene-positive fins, sp(+) (n = 9 fins), were compared to nontransgenic sp(-) siblings (n = 7 fins). B: The sp(+) transgenic fish showed reduced frequency of evx1 expression compared to the sp(-) nontransgenic sibling. Both sp(+) and sp(-) fish were similarly treated for heat shock. Statistically significant differences were determined by the Student's t-test, where P < 0.01 (**). Error bars represent the standard deviation. |
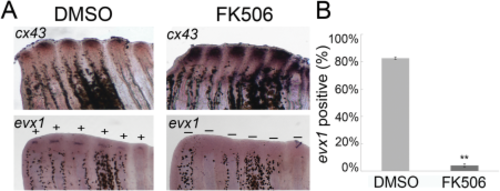
Inhibition of calcineurin (FK506-treatment) increases cx43 and reduces the frequency of evx1-positive rays. A: Whole-mount ISH shows increased cx43 and decreased evx1 expression at the time of joint initiation (87 hpa) in FK506-treated fish vs. DMSO (negative control). B: FK506-treated fish (n = 3 fins) showed reduced frequency of evx1-positive fin rays compared to DMSO-treated fish (n = 4 fins). Statistically significant differences were determined by the Student's t-test, where P < 0.01 (**). Error bars represent the standard deviation. |
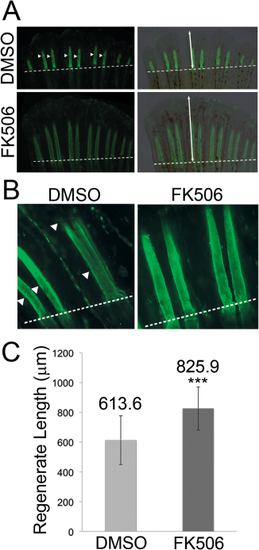
Inhibition of calcineurin (FK506 treatment) influences joint formation and regenerate length. A,B: Calcein staining detects bone matrix and reveals joint failure and increased regenerate length in FK506-treated wild-type fish compared to control DMSO-treated wild-type fish. Panels on the left show fluorescence; panels on the right show fluorescence plus bright-field to better illustrate the end of the regenerating fin (the dotted line indicates the amputation plane). Arrowheads point to joints. Double-headed arrows identify regenerate length. C: Regenerate length is significantly increased FK506-treated (n = 18) vs. DMSO-treated (n = 18, negative control) fish. Statistically significant differences were determined by the Student's t-test, where P < 0.001 (***). Error bars represent the standard deviation. |
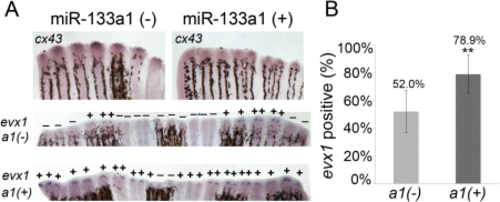
Reduced cx43 prior to joint formation increases the frequency of evx1-positive rays. A: Whole-mount ISH shows decreased cx43 expression and increased evx1 expression in the Tg(hsp70:miR-133a1)pd47 line at the time of joint initiation (87 hpa) in a1(+) (transgene-positive) vs. a1(-) (nontransgenic). Bottom panels in A show evx1-positive fin rays across entire fins. B: A higher percentage of fin rays in a1(+) transgenic fins showed expression of evx1 (n = 9 fins) compared to the a1(-) nontransgenic sibling (n = 9 fins). Both sp(+) and sp(-) fish were similarly treated for heat shock. Statistically significant differences were determined by the Student's t-test, where P < 0.01 (**). Error bars represent the standard deviation. |
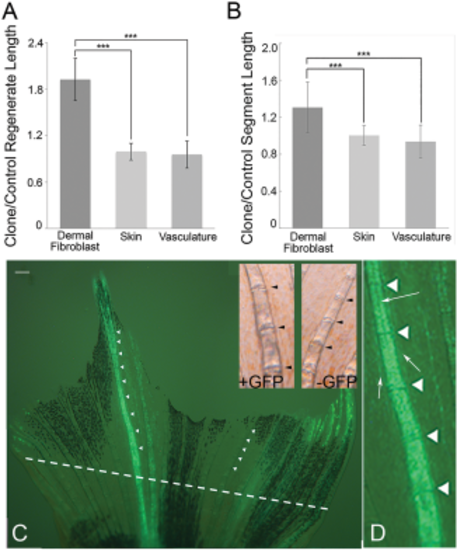
Expression of Cx43 in dermal fibroblasts rescues both regenerate length and segment length. A: Regenerate length is significantly increased in fins where Cx43 is induced in dermal fibroblasts, but not in fins where Cx43 is induced in other lineages. B: Segment length is significantly increased in fins where Cx43 is induced in dermal fibroblasts, but not in fins where Cx43 is induced in other lineages. Both regenerate and segment length measurements were taken as the ratio of the GFP-positive clone length over the analogous fin ray on the opposite side of the fin. Statistically significant differences were determined by the Student's t-test, where P < 0.001 (***). Error bars represent the standard deviation. C: Representative image of a fin containing a GFP-positive clone in the dermal fibroblasts. The amputation plane is indicated by a dotted line. Scale bar = 150 µm. Insets show higher magnification views of a region of both the GFP-positive fin ray and in the contralateral GFP-negative fin ray (bright-field is shown to better visualize the joints). Joints are indicated as arrowheads in both the GFP-positive fin ray and in the GFP-negative fin ray. D: Higher magnification view of the GFP-positive clone to show GFP expression in dermal fibroblasts. Dermal fibroblast clones are notable for the ability to see the unlabeled artery running down the middle of ray (arrow pointing to middle of ray), whereas osteoblast clones obscure the artery. Dermal fibroblast clones also show distinct GFP-positive fibroblast cells that are adjacent to, but not contained within, the ray itself (arrows pointing to GFP-positive cells flanking the ray), whereas osteoblast clones remain strictly associated with the hemirays. |