
Fig. 2
- ID
- ZDB-FIG-170913-2
- Publication
- Dardis et al., 2017 - Cx43 suppresses evx1 expression to regulate joint initiation in the regenerating fin
- Other Figures
- All Figure Page
- Back to All Figure Page
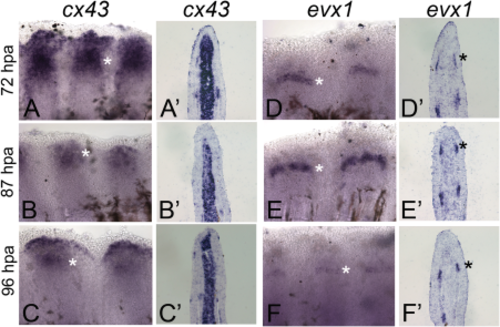
Expression of cx43 and evx1 during the joint initiation time line. Qualitative changes in cx43 and evx1 gene expression are shown. Whole-mount ISH for cx43 is shown at 72 hpf (A), 87 hpf (B), and 96 hpf (C). Cryo-ISH for cx43 is shown at 72 hpa (A'), 87 hpf (B'), and 96 hpf (C'). Whole-mount ISH for evx1 is shown at 72 hpf (D), 87 hpf (E), and 96 hpf (F). Cryo-ISH for evx1 is shown at 72 hpa (D'), 87 hpf (E'), and 96 hpf (F'). Asterisks identify regions of gene expression. Note that cx43 mRNA is detected medially in the dermal fibroblasts and laterally in a subset of cells in the osteoblast lineage, whereas evx1 mRNA is restricted to a subset of cells in the osteoblast lineage. |