
Image
|
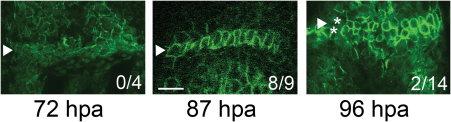
Figure Caption
Fig. 1
Establishment of the joint initiation time line. Fins were amputated at the 30% level and permitted to regenerate for 2–5 days before processing for ZNS5 immunofluorescence. Selected time points are shown. Fins at 87 hpa frequently exhibited “initiating” joints in the third fin ray from the dorsal or ventral side. The ratios in each image indicate the frequency of initiating joints at each time point. Arrowheads indicate the organizing joint-forming cells, and the asterisks in 96 hpa identify the separating rows of joint-forming cells. Scale bar = 20 µm.
Acknowledgments
This image is the copyrighted work of the attributed author or publisher, and
ZFIN has permission only to display this image to its users.
Additional permissions should be obtained from the applicable author or publisher of the image.
Full text @ Dev. Dyn.