- Title
-
MicroRNAs Establish Uniform Traits during the Architecture of Vertebrate Embryos
- Authors
- Kasper, D.M., Moro, A., Ristori, E., Narayanan, A., Hill-Teran, G., Fleming, E., Moreno-Mateos, M., Vejnar, C.E., Zhang, J., Lee, D., Gu, M., Gerstein, M., Giraldez, A., Nicoli, S.
- Source
- Full text @ Dev. Cell
|
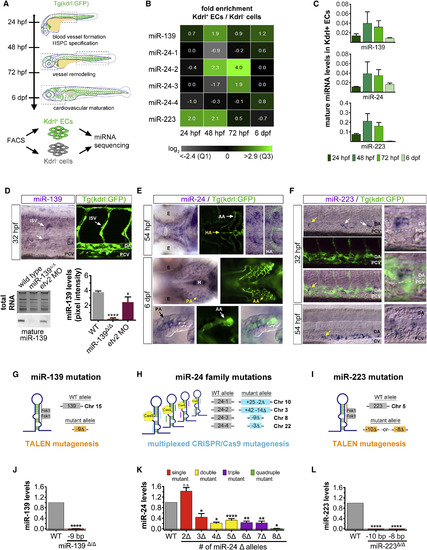
Generation of Endothelial miRNA Mutants in Zebrafish (A) Experimental procedure to identify miRNAs expressed in fluorescence-activated cell (FAC)-sorted Kdrl:GFP+ endothelial cells and Kdrl:GFP− non-endothelial cells during the four major stages of zebrafish vascular development. Dashed boxes outline the regions examined for cardiovascular phenotypes in endothelial miRNA mutant embryos (see Figure S2C). (B) Heatmap depicts miRNA reads per million in Kdrl:GFP+ endothelial relative to non-endothelial cells for two biological replicates. Color scale ranges from the first quartile (Q1) to the third quartile (Q3) fold-enrichment values for all 46 endothelial miRNAs identified (see Figure S1A). (C) Average mature miRNA levels relative to U6 small nuclear RNA (snRNA) expression as determined by qRT-PCR in FAC-sorted Kdrl:GFP+ endothelial cells at the indicated developmental stages. (D) Top: Lateral trunk view (20×) of wild-type embryos showing whole-mount in situ hybridization (WISH) for mature miR-139, labeling cells within the ISV position. Confocal image (25×) shows the relative position of ISVs in the lateral trunk. Bottom: northern blot and respective quantification showing mature miR-139 expression relative to total RNA in three biological replicates of 32-hpf embryos treated as indicated. Consistent with miR-139 expression in ISVs, mature miR-139 levels were diminished in etv2 morphant embryos, which lack these trunk vessels (Pham et al., 2007). (E) Mature miR-24 localization in the ventral head of wild-type embryos in relation to Kdrl:GFP+ vasculature at the indicated developmental stages (20×). By 6 dpf, miR-24 remained in vascular cells but was excluded from cartilaginous and bone structures. Arrows point to anatomic landmarks. Yellow arrows point to the region captured in zoomed-in images (40×). (F) Mature miR-223 localization in the lateral Kdrl:GFP+ trunk vasculature of wild-type embryos at the indicated stages (20×). At 54 hpf, miR-223 is expressed in cells within the caudal hematopoietic tissue located between the DA and CV. Arrows show examples of miR-223+ cells. Yellow arrows point to the region captured in magnified images. (G–I) Schematic representation of the genome-editing strategies employed to mutagenize endothelial miRNAs. TALENs and a multiplexed CRISPR/Cas9 system were targeted to miRNA precursor genomic sequences to prevent mature miRNA formation. Gray boxes represent the wild-type allele. Colored boxes reveal the nature of the mutant allele. See also Figure S2A. (J–L) qRT-PCR showing average mature miRNA expression normalized to U6 snRNA levels in miRNA mutant embryos (J), embryo heads (K), or adult fins (L) relative to wild-type. For miR-24 mutants, genotypes were categorized as a single mutant when two (Δ2, miR-24-4Δ/Δ) and three (Δ3, e.g., miR-24-1+/Δ 4Δ/Δ) miR-24 alleles were mutated, up to a quadruple mutant that lacked all eight miR-24 alleles (Δ8, miR-24-1Δ/Δ 2Δ/Δ 3Δ/Δ 4Δ/Δ). See also Figure S2B. Bar plots represent mean ± SEM and significance calculations are relative to wild-type embryos. n.s., not significant (p > 0.05); ∗p ≤ 0.05, ∗∗p ≤ 0.01, ∗∗∗∗p ≤ 0.0001, two-tailed Student's t test. qRT-PCR data represent two to five biological replicates. Ten to 20 embryos from at least two different clutches were examined by WISH. AA, aortic arches; DA, dorsal aorta; CV caudal vein; E, eye; EC, endothelial cell; H, heart; HA, hypobranchial artery; ISV, intersegmental vessel; PA, pharyngeal arch; PCV, posterior cardinal vein. |
|
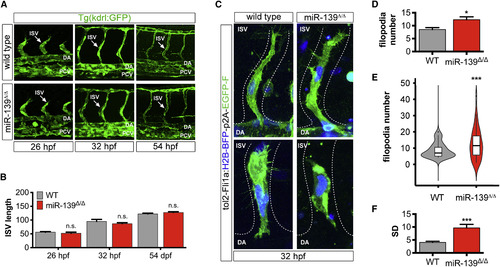
miR-139 Homozygous Mutants Exhibit Heterogeneity in Endothelial Cell Filopodia Number (A) Lateral view (25×) of Kdrl:GFP+ trunk vasculature at the indicated developmental stages. Arrows point to ISVs. (B) Average ISV length (μm) was determined from confocal projections (n = 9–18). Bar plots show mean ± SEM. (C) Representative images (40×) of single endothelial cells expressing tol2-Fli1a-H2B-BFP-p2A-EGFP-farnesyl vector in wild-type and miR-139Δ/Δ ISVs. miR-139Δ/Δ images depict endothelial cells with excessive (top) or few (bottom) filopodia. Endothelial cell nuclei are in blue and membranes are in green. (D) Bar plots show the average of replicate means ± SEM of endothelial cell filopodia number (n = 9 replicates). (E) Violin plots show filopodia number probability density distributions. Solid lines in box plots depict median values. Phenotypic variability was significantly different from wild-type, ∗∗∗p = 9.46 × 10⁻⁴ by Levene's test (n = 36 cells). (F) Bar plots show average replicate SD ± SEM of endothelial cell filopodia number (n = 9 replicates). Significance calculations were relative to wild-type embryos. n.s., not significant (p > 0.05); ∗p ≤ 0.05, ∗∗∗p ≤ 0.001, two-tailed Mann-Whitney U test unless otherwise indicated. Abbreviations as defined in Figure 1. See also Figure S3. |
|
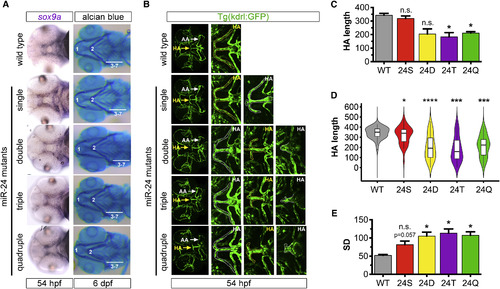
Enhanced Phenotypic Variability in Hypobranchial Artery Sprouting with Diminishing miR-24 Activity (A) sox9a WISH labeling chondrocyte progenitors (left) and Alcian blue-stained cartilage (right) in the ventral head of wild-type and miR-24 mutant embryos (n ≥ 6 for all genotypes except n = 2 for quadruple mutants). Numbers indicate the position of pharyngeal arches 1–7. miR-24 genotypes are categorized as in Figure S2B. (B) Ventral view (25×) of 54-hpf head vasculature. Magnified images depict the spectrum of HA phenotypes (dotted outlines) for each genotype. The HA sprout most representative of the genotype is indicated with a yellow arrow and is depicted in the zoomed-in picture with a yellow HA label. White arrows point to aortic arches (AA). (C) Bar plots show the average of replicate means ± SEM of HA length (μm) at 54 hpf (n = 4 replicates). (D) Violin plots show 54-hpf HA length (μm) probability density distributions. Solid lines in box plots depict median values. Phenotypic variability was statistically different from wild-type as determined by the Levene's test (n = 40 embryos). Single: ∗p = 0.04; double: ∗∗∗∗p = 5.77 × 10⁻⁶; triple: ∗∗∗p = 3.46 × 10⁻⁴; quadruple: ∗∗∗p = 7.57 × 10⁻⁴ (E) Bar plots show average replicate SD ± SEM of HA length (μm) at 54 hpf (n = 4 replicates). For all bar blots, S, single; D, double; T, triple; Q, quadruple mutant. Significance calculations were relative to wild-type embryos. n.s., not significant (p > 0.05); ∗p ≤ 0.05, ∗∗∗p ≤ 0.001, ∗∗∗∗p ≤ 0.0001, two-tailed Mann-Whitney U test unless otherwise indicated. EXPRESSION / LABELING:
PHENOTYPE:
|
|
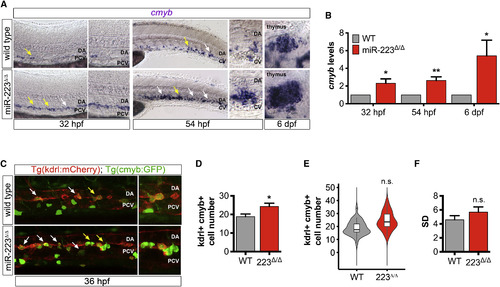
miR-223 Does Not Regulate Phenotypic Variability of HSPC Number (A) WISH of HSPC marker cmyb at transient sites of hematopoiesis, namely the DA ventral wall at 32 hpf, the caudal hematopoietic tissue between the DA and CV at 54 hpf, and the thymus, a definitive site of hematopoiesis, at 6 dpf (n = 10–20 embryos). Arrows show examples of cmyb+ cells. Yellow arrows indicate the region of the lateral trunk that is depicted in magnified images. Images captured with a 20× objective. (B) Mean cmyb expression in miR-223Δ/Δ embryos normalized to actb1 levels and compared with wild-type as determined by qRT-PCR for three biological replicates. Bar plots show mean ± SEM, two-tailed Student's t test. (C) Representative micrographs (25×) of the lateral trunk in embryos expressing Tg(kdrl:ras-mCherry)s896 and Tg(cmyb:GFP)zf169. Arrows point to examples of kdrl+cmyb+ cells budding from the DA ventral wall at the peak of hematopoiesis. Yellow arrows show region of the lateral trunk that is captured in zoomed-in images. (D) Bar plots show the average of replicate means ± SEM of kdrl+cmyb+ cell number at 36 hpf (n = 4 replicates). (E) Violin plots show kdrl+cmyb+ cell number probability density distributions. Solid lines in box plots depict median values. Phenotypic variability was not significantly different from wild-type, p = 0.24 by Levene's test (n = 36 embryos). (F) Bar plots show average replicate SD ± SEM of kdrl+cmyb+ cell number (n = 4 replicates). Significance calculations were relative to wild-type embryos. n.s., not significant (p > 0.05); ∗p ≤ 0.05, ∗∗p ≤ 0.01, two-tailed Mann-Whitney U test unless otherwise indicated. Abbreviations as defined in Figure 1. |
|
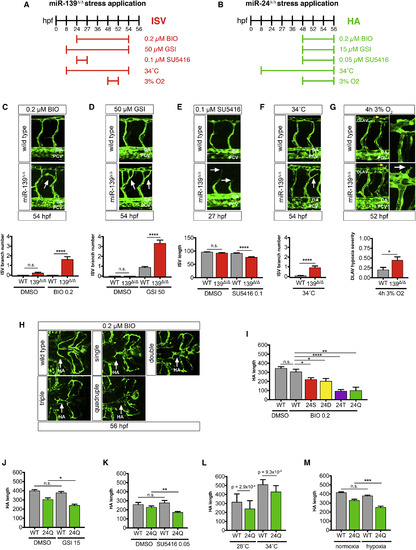
miR-139 and miR-24 Mutants Are Broadly Affected by Stress (A and B) Schematic depicts the duration of chemical exposure or environmental condition used to test stress sensitivity of miR-139-regulated (A) and miR-24-regulated (B) vascular traits in the absence of miRNA activity. Stressors were administered at doses that minimally affect wild-type as indicated (see Table S1). (C and D) Arrows point to ectopic ISV branches in 54-hpf miR-139Δ/Δ embryos treated with pro-angiogenic drugs: BIO (n = 24) and GSI (n = 50–55 embryos). Controls were treated with DMSO vehicle (n = 17–24 embryos). (E) Arrows highlight stunted ISV branches in 27-hpf miR-139Δ/Δ embryos treated with anti-angiogenic VEGF inhibitor SU5416 (n = 25–27 embryos). Controls were treated with DMSO vehicle (n = 17–25 embryos). (F) Arrows show ectopic ISV branches in 54-hpf miR-139Δ/Δ embryos exposed to high-temperature stress (n = 31–44 embryos/genotype). (G) Yellow arrows show region captured in zoom images. White arrow points to hypersprouting of DLAV endothelial cells in 52 hpf miR-139Δ/Δ embryos exposed to 4 hr of hypoxia (n = 40–45 embryos/genotype). (H) Arrows indicate the HA of BIO-treated embryos. (I–M) Quantification of 56-hpf HA length (μm) upon treatment of BIO or DMSO (n = 12–24 for all genotypes except n = 6 for quadruple mutant embryos, I); GSI or DMSO (n = 15, J); SU5416 or DMSO (n = 11–16, K); high or control temperature (n = 38–50, L); and hypoxia or normoxia (n = 24, M). S = single, D = double, T = triple, Q = quadruple mutant embryos. All images were captured with a 25× objective. All bar plots represent mean ± SEM, and significance comparisons between samples are as indicated. n.s., not significant (p > 0.05); ∗p ≤ 0.05, ∗∗p ≤ 0.01, ∗∗∗p ≤ 0.001, ∗∗∗∗p ≤ 0.0001, two-tailed Mann-Whitney U test. EXPRESSION / LABELING:
PHENOTYPE:
|
|
Phenotypic Heterogeneity Determines Trait Stress Sensitivity (A) Schematic depicts the duration of nitric oxide donor SNAP exposure to test stress sensitivity of kdrl+cmyb+ cell number in the absence of miR-223 activity. SNAP was given at a low dose that minimally affects wild-type as indicated (see Table S1). (B) Arrows show kdrl+cmyb+ cells budding from the DA ventral wall in untreated or SNAP-treated 36 hpf and miR-223 Δ/Δ (n = 11–12 embryos). 25× magnification. (C) Bar plots represent mean kdrl+cmyb+ cell number ± SEM. n.s., not significant (p > 0.05), two-tailed Mann-Whitney U test. (D) Proposed model for miRNA-mediated regulation of developing traits in vertebrates. miRNA targeting of single or multiple mRNAs in complex genetic networks can control the construction and/or robustness of a phenotypic trait. Upon loss of miRNA activity, a change only in phenotypic distribution (Gaussian or otherwise) predetermines a trait's sensitivity to changing environments. EXPRESSION / LABELING:
|
|
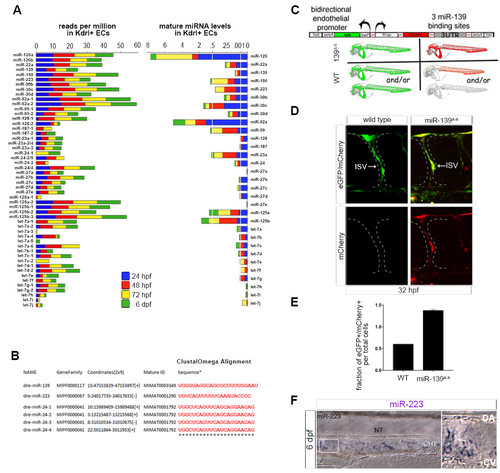
Expression of zebrafish endothelial miRNAs (related to Figure 1). (A) Left, sequencing reads per million for endothelial miRNAs expressed in FAC-sorted Kdrl:GFP+cells. Right, average mature miRNA levels relative to U6 snRNA expression in Kdrl:GFP+ endothelial cells as determined by qRT-PCR for two biological replicates. Developmental stages as indicated. (B) Clustal Omega alignment of mature sequences for endothelial miRNAs characterized in this study. (C) Design of miRNA sensor construct to detect miR-139 activity in endothelial cells. Plasmid contains Tol2 direct repeats that flank a bi-directional fli1ep enhancer-basal promoter cassette to drive endothelial-specific expression of i) mCherry regulated by a synthetic 3’UTR with 3 binding sites complementary to the mature miR-139 sequence and ii) control eGFP cassette. Sensor construct was injected into 1-cell zebrafish embryos with Tol2 transposase mRNA. Repression of mCherry expression occurs in the presence of miR-139 activity, while control eGFP expression remains constant. (D) Representative confocal micrographs of endothelial miRNA sensor expression in 32 hpf wild type and miR-139Δ/Δ embryos. mCherry derepression in ISVs indicates miR-139 loss of function in this vessel. (E) Quantification of vascular miR-139 activity by flow cytometry. Bar plots depict the fraction of total cells that express mCherry and GFP from the endothelial miR-139 sensor construct. Increased average number of double fluorescent cells in miR-139Δ/Δ embryos indicates loss of miR-139 activity in the endothelium. Error bars show mean + SEM of three biological replicates. (F) Mature miR-223 localization in the lateral Kdrl:GFP+ trunk vasculature of wild type embryos at 6 dpf. miR-223+ cells are observed within the caudal hematopoietic tissue (CHT) between the dorsal aorta (DA) and caudal vein (CV). White box shows region in the zoomed-in image. |
|
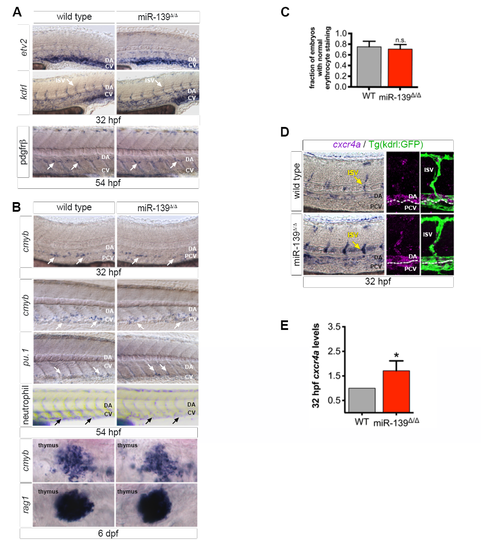
miR-139 does not regulate vessel outgrowth or flow-responsive processes (related to Figure 3). (A) WISH for angiogenesis markers etv2 and kdrl and smooth muscle cell marker pdgfrβ. No differences were noted in mutant embryos. (B) pu.1+ progenitors, sudan black stained neutrophils, and erythrocytes (C, below) were used to mark the myeloid hematopoietic lineage. rag1 marks lymphocytes. Blood production was unaffected in mutant embryos. (C) miR-139 target genes were enriched for erythrocyte development GO terms (Figure 2F), so we quantified the fraction of embryos with normal o-dianisidine staining of erythrocytes. Erythrocyte levels were not statistically different (n.s., p > 0.05) to wild type embryos at 54 hpf by two-tailed Mann-Whitney U-test. Bars show mean + SEM (D)WISH of vascular angiogenesis marker cxcr4a in wild type and mutant embryos. Yellow arrows in images (left) point to the ISVs captured in confocal projections that show cxcr4a within the lateral Kdrl:GFP+ trunk vasculature (middle, right). (E) Average fold expression of cxcr4a mRNA in miR-139Δ/Δ tails normalized to actb1 and relative to wild type tails at 32 hpf as determined by qRT-PCR for 5 biological replicates. Notably, the increase in cxcr4a expression does not result from a moderate disruption in blood flow (Packham et al., 2009) as flow-dependent formation of of cmyb+ HSPCs (North et al., 2009) and descending hematopoietic lineages were unaffected in miR-139Δ/Δ embryos (B-C). Bars indicate mean + SEM. *p ≤ 0.05, Student’s test For all images, arrows indicate representative staining and developmental stages are as indicated (n = 10-20 embryos). |
|
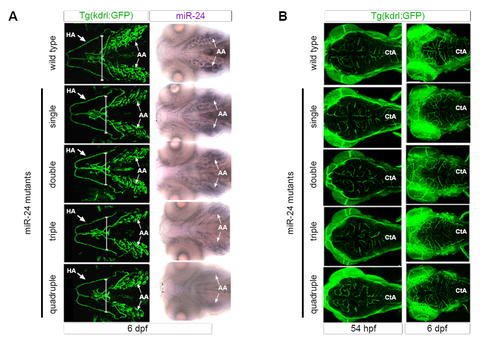
miR-24Δ/Δ embryos do not have delay in development (related to Figure 4). (A) Ventral view of Kdrl:GFP+ head vasculature (left) or mature miR-24 expression in the aortic arches (AA) (right). Mature miR-24 expression in AA diminishes upon increasingly loss of miR-24 gene copies. Arrows point to HA or AA. (B) Dorsal head vasculature is similar between miR-24Δ/Δ and wild type genotypes. Cta = central arteries Developmental times as indicated. |
|
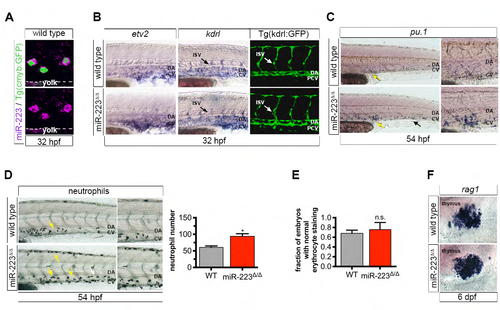
S5. miR-223Δ/Δ embryos have a specific defect in HSPC formation and neutrophil differentiation (related to Figure 5). (A) Confocal projection showing the localization of miR-223 WISH in cmyb:GFP+ HSPCs in the vasculature above the yolk extension. (B) WISH localization of vascular angiogenesis markers and vessel morphology revealed by Tg(kdrl:gfp)la116. Arrows show positively stained ISVs. No differences were detected between wild type and mutant embryos, suggesting that HSPC expansion in miR-223Δ/Δ is specific defect in HSPC production, and not a secondary consequence of abnormal vascular patterning. (C) miR-223Δ/Δ embryos exhibited an increase in pu.1+ myeloid progenitors by WISH in the caudal hematopoietic tissue (arrows), a transient site of hematopoiesis in the tail. Yellow arrows point to the region captured in magnified images. (D) Sudan black-stained neutrophils were increased in miR-223Δ/Δ embryos in CHT. Arrows point to positively stained cells. Yellow arrows point to the region captured in zoomed-in images. Bar plots show average of replicate means + SEM of neutrophil number. Significant difference *p ≤ 0.05 from wild type was determined by two-tailed Mann-Whitney U-test (n = 5 replicates of 10 embryos). (E) Quantification shows the fraction of embryos with normal o-dianisidine staining of erythrocytes at 32 hpf. Bars show average of replicate means + SEM. Erythrocyte staining was not statistically different (n.s., p > 0.05) to wild type embryos by two-tailed Mann- Whitney U-test (n = 3 replicates of 9-10 embryos). (F) Lymphocyte marker rag1 was unaffected upon loss of miR-223 as determined by WISH. For WISH and immunofluorescence experiments, n = 10-20 embryos. |
Reprinted from Developmental Cell, 40, Kasper, D.M., Moro, A., Ristori, E., Narayanan, A., Hill-Teran, G., Fleming, E., Moreno-Mateos, M., Vejnar, C.E., Zhang, J., Lee, D., Gu, M., Gerstein, M., Giraldez, A., Nicoli, S., MicroRNAs Establish Uniform Traits during the Architecture of Vertebrate Embryos, 552-565.e5, Copyright (2017) with permission from Elsevier. Full text @ Dev. Cell

