
- Title
-
The pre-rRNA processing factor DEF is rate limiting for the pathogenesis of MYCN-driven neuroblastoma
- Authors
- Tao, T., Sondalle, S.B., Shi, H., Zhu, S., Perez-Atayde, A.R., Peng, J., Baserga, S.J., Look, A.T.
- Source
- Full text @ Oncogene
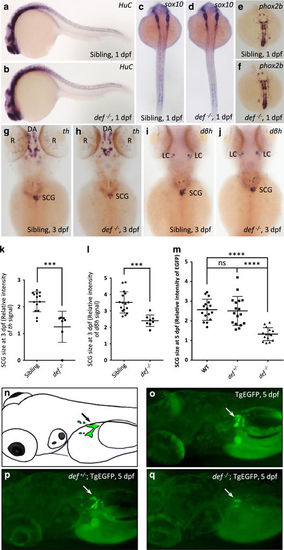
Loss of function of def affects sympathetic neuronal development in zebrafish. (a–j) Whole-mount in situ hybridization for HuC (a and b), sox10 (c and d), phox2b (e and f), th (g and h) and dβh (i and j) in def−/− mutant and sibling fish at the indicated genotypes and time points. (k–m) SCG signal intensity indicated by th (g and h), dβh (i and j) or EGFP (n–q) in fish of different def backgrounds was calculated. Horizontal bars indicate the means±s.d., which were compared with the two-tailed unpaired t-test. ***P<0.001; ****P<0.0001. (n–q) Schematic (n) and representative images (o–q) of SCG (arrows) development at 5 dpf in TgEGFP transgenic line with wild-type def (TgEGFP), def+/− (def+/−;TgEGFP) or def−/− (def−/−; TgEGFP) background. DA, diencephalic dopaminergic neurons; dpf, days post fertilization; LC, locus coeruleus; ns, not significant; R, retina; SCG, superior cervical ganglion. |
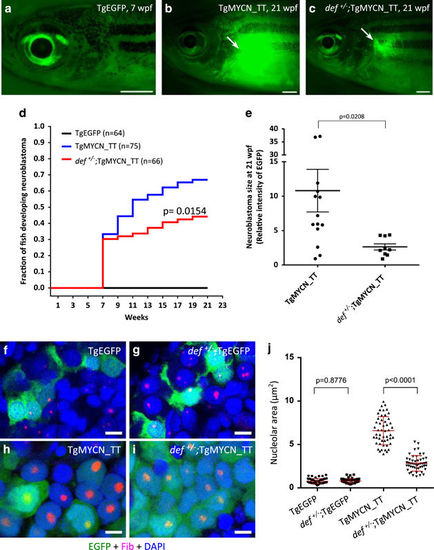
def haploinsufficiency decreases the penetrance and inhibits the growth of tumors in the TgMYCN_TT neuroblastoma model. (a–c) In TgMYCN_TT transgenic line with wild-type def (TgMYCN_TT) (b) or def+/− (def+/−;TgMYCN_TT) (c) background, EGFP expressed in the tumor (arrows) arose in the IRG at 21 wpf. TgEGFP transgenic line (a) was used as negative control. Scale bar, 1 mm. (d) Cumulative frequency of neuroblastoma in stable transgenic lines analyzed by Kaplan–Meier method. The difference between tumor onset by 21 wpf for TgMYCN_TT and def+/−;TgMYCN_TT is significant at P=0.0154 by the log-rank test. (e) Tumor size in transgenic fish of different backgrounds (b and c) was calculated. Horizontal bars indicate the means±s.e.m., which were compared with the two-tailed unpaired Welch t-test, P=0.0208. (f–i) Coimmunostaining of EGFP and nucleolar marker Fib of the sagittal sections through IRG of TgEGFP (f) and def+/−;TgEGFP (g), and the tumor sections of TgMYCN_TT (h) and def+/−;TgMYCN_TT (i) transgenic lines at 7 wpf. Nuclei were stained with DAPI. Scale bar, 5 μm. (j) Nucleolar area indicated by nucleolar marker Fib in the sections of (f–i) was calculated. Horizontal bars indicate the means±s.e.m., which were compared with the two-tailed unpaired Welch t-test. wpf, weeks post fertilization. EXPRESSION / LABELING:
PHENOTYPE:
|
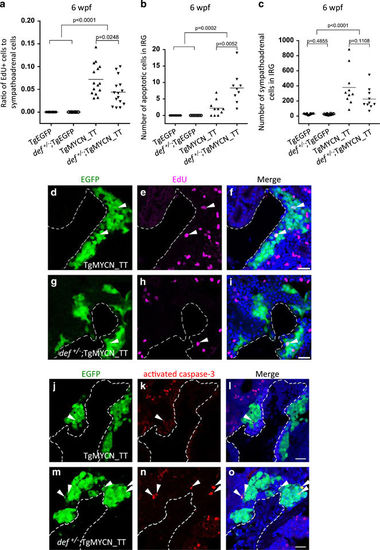
def haploinsufficiency decreases cell proliferation and increases apoptotic cell death of sympathoadrenal lineage cells overexpressing MYCN in the IRG at 6 wpf. (a–c) Fraction of EdU-positive sympathoadrenal cells (a), numbers of activated caspase-3-positive apoptotic sympathoadrenal cells (b) and of total EGFP+/dβh+ sympathoadrenal cells (c) in the IRG of control TgEGFP and def+/−;TgEGFP, TgMYCN_TT and def+/−;TgMYCN_TT transgenic fish were plotted at 6 wpf. Each symbol represents the value for an individual fish. Horizontal bars represent mean values that were compared with the two-tailed unpaired Welch t-test (a and c) or two-tailed Fisher’s exact test (b). (d–i) Coimmunostaining of EGFP and EdU of the sagittal sections through IRG of EdU-labeled TgMYCN_TT (d–f) and def+/−;TgMYCN_TT (g–i) transgenic lines at 6 wpf. Nuclei were stained with DAPI. Arrowheads indicate the EdU-labeled proliferating sympathoadrenal cells. Dotted lines indicate the head kidney (HK) boundary. Scale bar, 20 μm. (j–o) Coimmunostaining of EGFP and activated caspase-3 of the sagittal sections through IRG of TgMYCN_TT (j–l) and def+/−;TgMYCN_TT (m–o) transgenic lines at 6 wpf. Nuclei were stained with DAPI. Arrowheads indicate the activated caspase-3-positive apoptotic sympathoadrenal cells. Dotted lines indicate the HK boundary. Scale bar, 20 μm. |
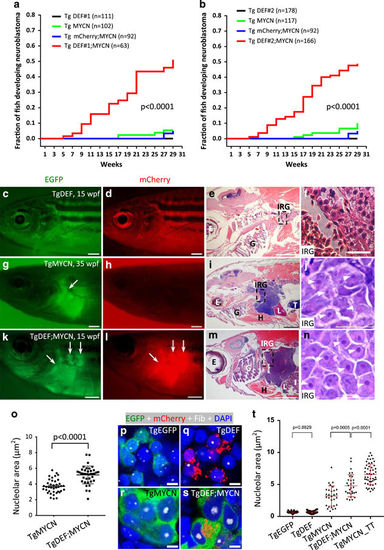
DEF accelerates tumor onset and increases the penetrance of MYCN-induced neuroblastoma. (a, b) Cumulative frequency of neuroblastoma in two independent DEF stable transgenic lines by Kaplan–Meier analysis. The difference between tumor onset by 29 wpf for TgDEF#1;MYCN (a) and TgDEF#2;MYCN (b) vs TgmCherry;MYCN transgenic fish is significant at P<0.0001 and P<0.0001 (by the log-rank test), respectively. (c, d) A 15 wpf TgDEF transgenic line without detectable EGFP and mCherry-positive tumor in the IRG. (g, h) A 35 wpf TgMYCN transgenic line with an EGFP-positive tumor (arrow) arising in the IRG. (k, l) A 15 wpf TgDEF;MYCN compound transgenic line with an EGFP and mCherry-positive tumor (arrows) arising in the IRG. Scale bars represent 1 mm for c, d, g, h, k and l. (e, f, i, j, m and n) H&E-stained sagittal sections of TgDEF transgenic line (e and f), TgMYCN transgenic line with neuroblastoma (i and j) and TgDEF;MYCN transgenic line with neuroblastoma (m and n). Boxes in e, i and m indicate the IRG, and are magnified in f, j and n, respectively. Arrowheads indicate the nucleoli. Scale bars represent 1 mm for e, i and m, and 20 μm for f, j and n. (o) Nucleolar area indicated by H&E staining in the tumor sections of TgMYCN (j) and TgDEF;MYCN (n) transgenic fish was calculated. Horizontal bars indicate the means±s.e.m., which were compared with the two-tailed unpaired Welch t-test, P<0.0001. (p–s) Coimmunostaining of EGFP, mCherry and Fib of the sagittal sections through IRG of TgEGFP (p), TgDEF (q), TgMYCN (r) and TgDEF;MYCN (s) transgenic lines at 6 wpf. Nuclei were stained with DAPI. Scale bar, 4 μm. (t) Nucleolar area indicated by staining with the nucleolar marker Fib in the sections of (p–s) and Figure 2h was calculated. Horizontal bars indicate the means±s.e.m., which were compared with the two-tailed unpaired Welch t-test. E, eye; G, gill; H, heart; I, intestine; IRG, interrenal gland; L, liver; T, testis; wpf, weeks post fertilization. |

ZFIN is incorporating published figure images and captions as part of an ongoing project. Figures from some publications have not yet been curated, or are not available for display because of copyright restrictions. PHENOTYPE:
|
|
ZFIN is incorporating published figure images and captions as part of an ongoing project. Figures from some publications have not yet been curated, or are not available for display because of copyright restrictions. EXPRESSION / LABELING:
PHENOTYPE:
|
|
ZFIN is incorporating published figure images and captions as part of an ongoing project. Figures from some publications have not yet been curated, or are not available for display because of copyright restrictions. EXPRESSION / LABELING:
PHENOTYPE:
|
|
ZFIN is incorporating published figure images and captions as part of an ongoing project. Figures from some publications have not yet been curated, or are not available for display because of copyright restrictions. EXPRESSION / LABELING:
|
|
Unillustrated author statements PHENOTYPE:
|