
Fig. 3
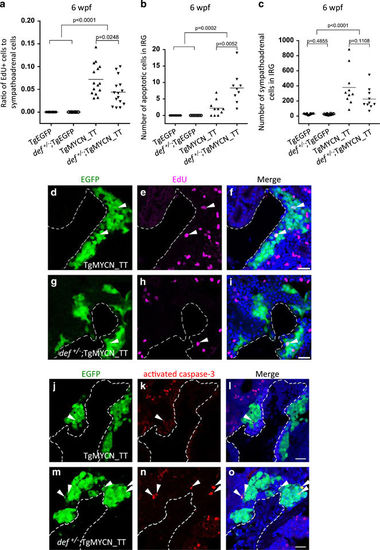
def haploinsufficiency decreases cell proliferation and increases apoptotic cell death of sympathoadrenal lineage cells overexpressing MYCN in the IRG at 6 wpf. (a–c) Fraction of EdU-positive sympathoadrenal cells (a), numbers of activated caspase-3-positive apoptotic sympathoadrenal cells (b) and of total EGFP+/dβh+ sympathoadrenal cells (c) in the IRG of control TgEGFP and def+/−;TgEGFP, TgMYCN_TT and def+/−;TgMYCN_TT transgenic fish were plotted at 6 wpf. Each symbol represents the value for an individual fish. Horizontal bars represent mean values that were compared with the two-tailed unpaired Welch t-test (a and c) or two-tailed Fisher’s exact test (b). (d–i) Coimmunostaining of EGFP and EdU of the sagittal sections through IRG of EdU-labeled TgMYCN_TT (d–f) and def+/−;TgMYCN_TT (g–i) transgenic lines at 6 wpf. Nuclei were stained with DAPI. Arrowheads indicate the EdU-labeled proliferating sympathoadrenal cells. Dotted lines indicate the head kidney (HK) boundary. Scale bar, 20 μm. (j–o) Coimmunostaining of EGFP and activated caspase-3 of the sagittal sections through IRG of TgMYCN_TT (j–l) and def+/−;TgMYCN_TT (m–o) transgenic lines at 6 wpf. Nuclei were stained with DAPI. Arrowheads indicate the activated caspase-3-positive apoptotic sympathoadrenal cells. Dotted lines indicate the HK boundary. Scale bar, 20 μm. |
| Fish: | |
|---|---|
| Observed In: | |
| Stage: | Days 30-44 |