
Fig. 4
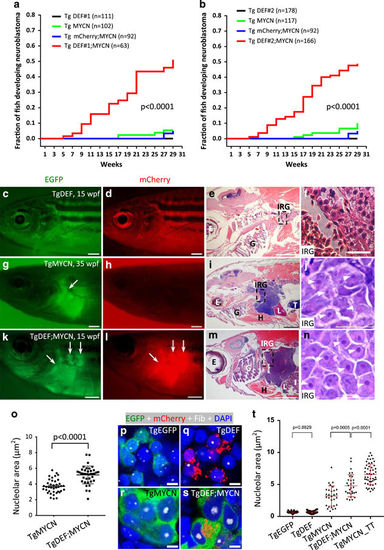
DEF accelerates tumor onset and increases the penetrance of MYCN-induced neuroblastoma. (a, b) Cumulative frequency of neuroblastoma in two independent DEF stable transgenic lines by Kaplan–Meier analysis. The difference between tumor onset by 29 wpf for TgDEF#1;MYCN (a) and TgDEF#2;MYCN (b) vs TgmCherry;MYCN transgenic fish is significant at P<0.0001 and P<0.0001 (by the log-rank test), respectively. (c, d) A 15 wpf TgDEF transgenic line without detectable EGFP and mCherry-positive tumor in the IRG. (g, h) A 35 wpf TgMYCN transgenic line with an EGFP-positive tumor (arrow) arising in the IRG. (k, l) A 15 wpf TgDEF;MYCN compound transgenic line with an EGFP and mCherry-positive tumor (arrows) arising in the IRG. Scale bars represent 1 mm for c, d, g, h, k and l. (e, f, i, j, m and n) H&E-stained sagittal sections of TgDEF transgenic line (e and f), TgMYCN transgenic line with neuroblastoma (i and j) and TgDEF;MYCN transgenic line with neuroblastoma (m and n). Boxes in e, i and m indicate the IRG, and are magnified in f, j and n, respectively. Arrowheads indicate the nucleoli. Scale bars represent 1 mm for e, i and m, and 20 μm for f, j and n. (o) Nucleolar area indicated by H&E staining in the tumor sections of TgMYCN (j) and TgDEF;MYCN (n) transgenic fish was calculated. Horizontal bars indicate the means±s.e.m., which were compared with the two-tailed unpaired Welch t-test, P<0.0001. (p–s) Coimmunostaining of EGFP, mCherry and Fib of the sagittal sections through IRG of TgEGFP (p), TgDEF (q), TgMYCN (r) and TgDEF;MYCN (s) transgenic lines at 6 wpf. Nuclei were stained with DAPI. Scale bar, 4 μm. (t) Nucleolar area indicated by staining with the nucleolar marker Fib in the sections of (p–s) and Figure 2h was calculated. Horizontal bars indicate the means±s.e.m., which were compared with the two-tailed unpaired Welch t-test. E, eye; G, gill; H, heart; I, intestine; IRG, interrenal gland; L, liver; T, testis; wpf, weeks post fertilization. |
| Fish: | |
|---|---|
| Observed In: | |
| Stage Range: | Days 7-13 to Adult |