- Title
-
Mycobacterium abscessus-Induced Granuloma Formation Is Strictly Dependent on TNF Signaling and Neutrophil Trafficking
- Authors
- Bernut, A., Nguyen-Chi, M., Halloum, I., Herrmann, J.L., Lutfalla, G., Kremer, L.
- Source
- Full text @ PLoS Pathog.
|
Expression of TNF by macrophages during Mabs infection. (A) Measurement of relative tnf-α expression by qRT-PCR using ef1α as a reference gene in whole embryo over PBS. Around 150 Mabs R or S variants were iv injected and assessed at 2 and 5 dpi. Mean log10 value of three independent experiments with error bars representing the standard error of the mean (SEM). (B-D) Tg(tnf-α:eGFP-F) larvae were injected in the otic cavity with ≈100 Mabs R or S variants (tdTomato) or with PBS. (B) Bright-field and fluorescence overlay microscopy showing the representative expression of tnf close to the injection site at 2 hpi. Scale bars, 100 μm. (C-D) Mean proportion of infected larvae with tnf+ cells (n = 10) (C) and quantification of tnf+ cells per infected larvae (each symbol represents individual embryos and horizontal lines indicate the mean values) (D) in (C) after 2 hpi. The data are representative of two experiments. (E) Distribution of tnfα-expressing cells revealed by the tnf-α:eGFP-F reporter transgene (arrows) in whole Tg(tnf-α:eGFP-F) larvae imaged live at the indicated time points post iv injection of PBS, Mabs R or S (tdTomato, ≈150 colony forming units (CFU)). The yolk (*) is auto-fluorescent. Scale bars, 200 μm. (F-H) Confocal images showing the representative tnf expression in a 3 dpi-granuloma (F) (scale bar, 20 μm), in a 5 dpi-brain abscess (G) (scale bar, 50 μm) or close to a 3 dpi-cord (H) (scale bars, 20 μm) in Tg(tnf-α:eGFP-F) embryos iv infected with Mabs R (tdTomato). (I-J) Confocal microscopy of a 3 dpi-granuloma showing the tnf expression in Tg(tnf-α:eGFP-F/mpeg1:mCherryF) (I) or Tg(tnf-α:eGFP-F/LysC:DsRed) (J) double transgenic embryos iv infected with Mabs R (E2-Crimson). Scale bars, 50 μm. Statistical significance was determined by Kruskal-Wallis test with Dunns post-test (A), Fisher’s exact test of a contingency table (C) or one-tailed unpaired Student’s t test (D). EXPRESSION / LABELING:
PHENOTYPE:
|
|
tnfr morphants are highly susceptible to Mabs infections. (A-H) WT or tnfr morphants were iv infected with either R (A-H) or S (A-D) variants of Mabs (tdTomato, ≈150 CFU). (A) Survival of infected embryos versus PBS-injected embryos (n = 90, average of three independent experiments). (B-C) Representative fluorescence images of: (B) Bacterial loads (FPC, two independent experiments, horizontal lines indicate the median values); (C) 3 dpi embryos infected by either R or S variants. Scale bars, 200 μm. (D) Proportion of larvae with abscesses after 13 dpi expressed as mean ± SEM from two independent experiments (n = 40–50). (E) Kinetic of R-cord formation in whole infected embryos. Mean ± SEM from three independent experiments (n = 30). (F) Fluorescence microscopy of tnfr morphants exhibiting widespread R-cording in the vasculature and in the CNS at 3 dpi. Scale bar, 200μm. (G-H) Proportion of embryos containing <5 or >5 cords (G) and localization of cords (H) in (E). Error bars represent the SEM. Statistical significance was determined by log-rank test (A), one-tailed Mann-Whitney’s t test (C) or Fisher’s exact test of a contingency table (D-E and G-H). PHENOTYPE:
|
|
Inhibition of intramacrophage Mabs growth correlates with TNF-mediated ROS production. (A-E) WT or tnfr morphant Tg(mpeg1:mCherry-F) embryos were iv infected with ≈150 R or S Mabs expressing tdTomato (A and B) or E2 crimson (C-E). (A) Number of infected macrophages in the caudal hematopoietic tissue (CHT) at 4 hpi. Horizontal lines indicate the mean values. (B) Average proportions of macrophages containing <5, 5 to 10, or >10 bacteria in the CHT at 1 dpi (n = 20 embryos for each group). Top panel shows confocal images of each representative class of infected macrophages. Scale bar, 5 μm. (C-E) CellRox green (green) staining of ROS production in infected embryos. (C) Confocal microscopy of ROS-positive infected macrophages. Scale bars, 10 μm. (D) Average proportions ROS-producing macrophages within the CHT in 1 dpi embryos (n = 30 embryos for each group). Error bars represent the SEM. (E) Representative fluorescence microscopy of 3 dpi-granuloma. Scale bars, 10 μm. Statistical significance was determined by one-tailed unpaired Student’s t test (A) or Fisher’s exact test of a contingency table (B and D). Data are representative of two independent experiments. EXPRESSION / LABELING:
PHENOTYPE:
|
|
M. abscessus infections are associated with a massive neutrophil mobilization. (A-D) Confocal live imaging of Tg(mpx:eGFP) larvae after iv (A and D) or intramuscular (B and C) infection with ≈100 Mabs R (tdTomato). (A-B) Time-lapse of neutrophils recruitment in caudal vein (A), monitored from 20 mpi to 110 mpi, or into muscle (B) monitored from 10 mpi to 150 mpi. Scale bars, 20 μm. (C) Recruited neutrophils phagocytizing individual mycobacteria. Scale bar, 5 μm. (D) Neutrophils (arrows) and presumptive macrophages (*), containing mycobacteria. Scale bar, 20 μm. (E) Number of infected neutrophils and macrophages counted in CHT at 4 hrs post intravenous infection with both Mabs variants (≈150 CFU, three independent experiments, horizontal lines indicate mean values). M, macrophage; N, neutrophils. Statistical significance was determined by one-tailed unpaired Student’s t test. (F) Confocal imaging of neutrophil-bacteria interactions in the context of R-abscess. Scale bars, 20 μm. See also S1 Movie. EXPRESSION / LABELING:
|
|
IL8-dependent recruited neutrophils phagocytize Mabs at initial sites of infection. (A) qRT-PCR measurement of il8 transcripts during Mabs R- or S-infections (≈150 CFU) in whole embryos at 2 and 5dpi. Mean log10 ± SEM of three independent experiments. (B) WT or il8 morphants Tg(mpx:eGFP) embryos were infected into the muscle (left), the hindbrain (middle) or the otic vesicle (right) with ≈100 R or S Mabs. Number of recruited neutrophils in injection sites at 3 hpi (two independent experiments, horizontal lines indicate the median values). (C) Microscopy showing representative neutrophil recruitment to R-abscesses in the brains of WT versus il8 morphants Tg(mpx:eGFP) larvae at 5 dpi. Scale bar, 100 μm. (D and E) WT or il8 morphants were iv infected with either R or S (tdTomato, ≈150 CFU). (D) Survival of R-(left) or S-infected (right) embryos (n = 50–60, average of two independent experiments). (E) Representative images of infected larvae at 3 dpi. Scale bars, 200 μm. (F and G) WT or csf3r morphants were iv infected with either R or S expressing tdTomato (≈150 CFU). (G) Survival of R-(left) or S-infected (right) embryos (n = 50–60, two independent experiments). (H) Representative images of infected larvae at 3 dpi. Scale bars, 200 μm. Statistical significance was determined by Kruskal-Wallis test with Dunns post-test (A), one-tailed unpaired Student’s t test (B) or by log-rank test (D and F). EXPRESSION / LABELING:
PHENOTYPE:
|
|
TNF signaling is required for neutrophil recruitment. (A-D) WT or tnfr morphant Tg(mpx:eGFP) larvae were injected in the otic cavity (A-B) or hindbrain (C-D), with both variants of Mabs (tdTomato, ≈100 CFU, two or three experiments) and imaged at 3 hpi. Representative images (A and C) and number (B and D) (horizontal lines indicate the mean values) of neutrophils at the infection site. Scale bars, 100 μm. (E and F) Confocal image of neutrophils surrounding a 3 dpi R-cord (E) (Scale bars, 50 μm) or a 5 dpi R-abscess (F) (Scale bars, 100 μm) in iv infected WT or tnfr morphant Tg(mpx:eGFP) embryos. Statistical significance was determined by one-tailed Student’s t test (B and D). See also S2–S5 Movies. EXPRESSION / LABELING:
PHENOTYPE:
|
|
Recruitment of neutrophils is crucial for granuloma development. (A and B) WT or tnfr morphants were iv infected with R Mabs (tdTomato, ≈150 CFU). Kinetics of granuloma formation (A) and mean ± SEM number of granuloma per infected embryos (B) in (A); (n = 30–45, three independent experiments). The top panel shows confocal images of representative granuloma. Scale bars, 100 μm. (C) Confocal images showing a representative 3 dpi granulomas in WT versus tnfr1 morphant Tg(mpeg:mcherry-F) embryos iv infected with S expressing Wasabi. Arrows indicate extracellular aggregates. Scale bars, 15 μm. (D) Confocal microscopy showing representative granulomas in WT and tnfr1 morphant Tg(mpx:eGFP) embryos iv infected with R expressing tdTomato at 4 dpi. Arrows indicate extracellular cords. Scale bars, 30 μm. (E-F) Confocal microscopy monitored WT or tnfr morphant Tg(mpx:eGFP) embryos that were iv infected with R (tdTomato, ≈150 CFU). (E) Representative kinetics of neutrophil mobilization during granuloma formation. Scale bars, 20 μm. (F) Number of neutrophils recruited to WT (up) or TNFR1-depleted (down) granuloma as a function of granuloma volume. Statistical significance was determined by Fisher’s exact test of a contingency table (A), one-tailed unpaired Student’s t test (B) or Pearson correlation (F). See also S6 and S7 Movies. |
|
IL8-dependent mobilization of neutrophils is crucial for controlling M. abscessus infection and elaborating granulomas. (A) qRT-PCR of il8 (normalized to ef1α) upon Mabs infection in R Mabs iv infected WT, tnfr morphants or LipoC embryos (≈150 CFU). Fold induction to PBS- injected animals at 3 dpi. Data are mean ± SEM of two independent experiments. (B and C) WT, LipoC embryos (B) or tnfr morphants (C) Tg(mpx:eGFP) embryos were infected into the otic vesicle with ≈150 R Mabs and treated with IL8 injection. Mean number of recruited neutrophils into the otic cavity in response to Mabs/IL8 injection at 3 hpi. Each symbol represents individual embryos and horizontal lines indicate the mean values. (D-F) WT or tnfr morphants were injected into the otic cavity with either ≈150 R or S variants expressing tdTomato and treated with IL8 injection. (D) Survival of R-(up) or S-infected (down) embryos (n = 50–60, two independent experiments). (E-F) Bacterial loads (FPC, two independent experiments, horizontal lines indicate the mean values) (E) and representative confocal images (F) of 3 dpi embryos. Scale bars, 200 μm. (F and G) WT, il8 or csf3r morphants were iv infected with R Mabs (tdTomato, ≈150 CFU). Kinetics of granuloma formation (G) and number of granuloma per infected embryos (H) assessed at 3 dpi. Mean ± SEM from two independent experiments (n = 40). (I) Number of neutrophils recruited to WT or IL8-depleted granulomas as a function of the granuloma volume at 2 dpi. Statistical significance was determined by Kruskal-Wallis test with Dunns post-test (A and H), ANOVA with Tukey post-test (B, C and E), log-rank test (D), Fisher’s exact test of a contingency table (G) or Spearman correlation (I). EXPRESSION / LABELING:
PHENOTYPE:
|
|
Early TNF-α Response Induction following Mabs infections. (A) Tg(tnf-α:eGFP-F) embryos were infected into caudal vein with ≈100 Mabs-expressing tdTomato. Microscopy showing the representative expression of tnf-α close to the injection site at 2 hpi. Scale bar, 300 μm. (B-C) Fluorescence microscopy analysis of the GFP expression in Tg(tnf-α:eGFP-F/mpeg1:mCherryF) (B) or Tg(tnf-α:eGFP-F/LysC:DsRed) (C) double transgenic embryos at 1 day following intravenous infection by either ≈100 R- or S-expressing E2-Crimson. (B) Close-up to the tip of the tail revealing that the transcriptomic tnf-α expression is detected in infected macrophages or in macrophages close to the infected tissue. Scale bars, 200 μm. (C) Confocal images of a single Mabs-infected macrophage (yellow arrow) close to the injection site induced a strong tnf-α expression. Neutrophils are indicated with white arrows. Scale bar, 10 μm. (D) tnf-α expression was tested in Tg(tnf-α:GFP-F) zebrafish embryo in absence of macrophages (lipo-clodronate injection). Embryos were infected with Mabs (R variant, ≈100 CFU) in the otic cavity and the proportion of infected embryos with eGFP-positive cells at 2 hpi counted. Graphs represent the mean value of two independent experiments (n = 10). |
|
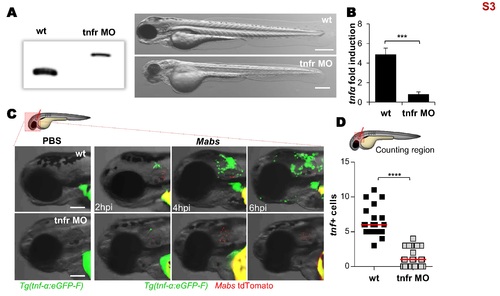
Tnfr1 morphants generation. (A-D) Efficiency of morpholino against zebrafish TNFR1. (A) Injection of splice-site blocking antisens morpholinos targeting the TNF receptor 1 (tnfr) leads to a total absence of native tnfr1 transcript. Comparison between WT embryos and tnfr morphants transcripts (2 dpf) reveals the complete absence of native transcript. Bright-field microscopy image comparing the whole morphology appearance of WT embryos versus tnfr morphants at 2 dpf, showing that morpholino knockdown injection produces a moderate hypomorph phenotype: short body length, big yolk sac, smaller swim bladder, small eyes, reduced pigmentation, hindbrain defects, somites poorly organized and epidermic alterations. Scale bars, 200 μm. (B-D) To check the effect of tnfr1 loss-of-function on the tnf-α production, PBS or tdTomato-Mabs (R variant, ≈100 CFU) were injected intravenously (B) or into the otic cavity of either WT or tnfr morphants Tg(tnf-α:eGFP-F) larvae (C-D). (B) qRT-PCR of tnfα (normalized to ef1α) upon Mabs infection. Fold induction compared to entire PBS- injected fishes at 3 dpi. Error bars indicate SEM. (C) Bright-field and fluorescence overlay microscopy showing the real-time visualization of the transcriptional tnf-α expression close to the injection site assessed at 2, 4 and 6 hpi. Scale bars, 100 μm. (D) Number of tnf-α positive cells per infected larvae evaluated at 2 hpi using confocal microscopy. Each symbol represents individual embryos and horizontal lines indicate the median values. (B and D) Statistical significance was assessed by one-tailed Mann-Whitney’s t test. TNF-α expression subsequent to the infection is impaired in tnfr morphants. Results are presented as average number from two experiments. |
|
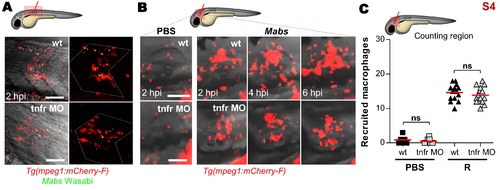
Ablation of TNF signaling does not affect the early chemoattraction of macrophages to localized Mabs infections. To evaluate the effect of absence of TNF signaling on early and late macrophages recruitment, WT or tnfr morphants Tg(mpeg1:mCherry-F) larvae were injected with either PBS or Wasabi-expressing Mabs (R variant) into the muscle (A) or otic cavity (B-C), monitored and imaged using confocal microscopy to measure macrophage recruitment. (A) Representative confocal microscopy of macrophages recruitment into the infected muscle at 2 hpi (dotted line outlines 2 somitic muscles). Scale bars, 100 μm. (B-C) Dynamic of macrophage recruitment at the infection site assessed at 2, 4 and 6 hpi (Scale bars, 50 μm) (B) and number of recruited macrophages at 2 hpi (C). Results are presented as average number from two experiments. Each symbol represents individual embryos and horizontal lines indicate mean values. Significance was assessed by one-tailed unpaired Student’s t test. In both WT- and tnfr morphant-infected animals, macrophages are recruited towards bacteria at the same rate at early time post-infection. However, while the number of newly recruited macrophages increased progressively in WT larvae from 2 hpi to 6 hpi, the number of recruited macrophages remains constant in tnfr morphants. |
|
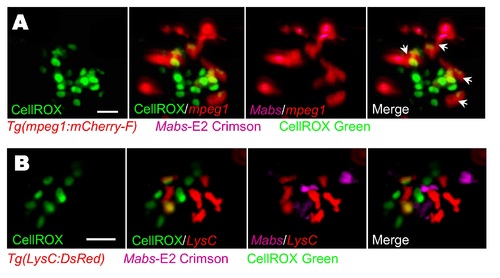
ROS production by hematopoietic cells following systemic Mabs infection. Evaluation of ROS induction in infected embryos using CellROX Green fluorescent. Tg(mpeg1:mCherry-F) (A) or Tg(LysC:DsRed) (B) were iv infected with E2 Crimson-expressing Mabs (R variant) and monitored for the ROS detection. (A) Confocal microscopy of agglomerates of hematopoietic cells display ROS production. Scale bar, 15 μm. Arrows indicate ROS-positive macrophages. (B) Mobilization of neutrophils close to infected tissue with agglomerates of hematopoietic cells producing ROS is revealed by confocal microscopy. Scale bar, 20 μm. |
|
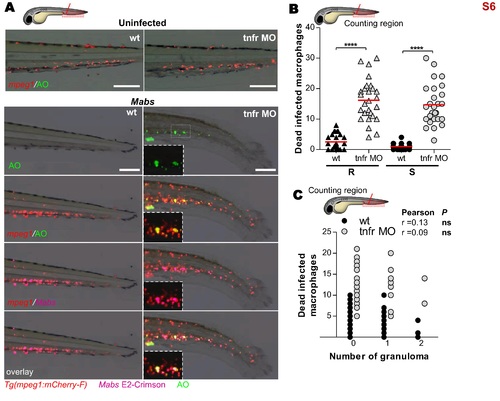
Absence of TNF signaling promotes macrophages death. (A and B) WT or tnfr morphants Tg(mpeg1:mCherry-F) were iv infected with either R or S variants of Mabs expressing E2 Crimson (≈150 CFU) and stained for dead macrophages with acridine orange (AO). (A) Representative microscopy showing the dead macrophages in 2 dpi R-infected embryos. Scale bars, 80 μm. (B) Number of dead infected macrophages evaluated using confocal microscopy at 2 dpi. Each symbol represents individual embryos and horizontal lines indicate mean values. (C) WT, il8 or csf3r morphants Tg(mpeg1:mCherry-F) were iv infected with either R or S variants (≈150 CFU) and stained for dead macrophages with acridine orange (AO). Statistical significance was determined by one-tailed Student’s t test (B) or Pearson correlation (C). Results are presented as the average number from two experiments. |
|
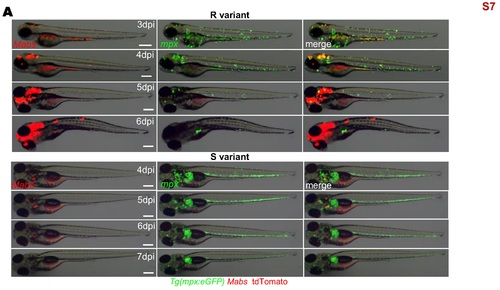
Behavior of neutrophils during Mabs infection. To investigate the behavior of neutrophils following the systemic Mabs infection, either R- or S-tdTomato (≈150 CFU) were iv injected in Tg(mpx:eGFP) embryo. Infected embryos were monitored and imaged at different time points following injection to monitor neutrophils recruitment at the infection foci. Bright-field and fluorescence overlay image showing representative recruitment of neutrophils following infections. Scale bars, 200 μm. |
|
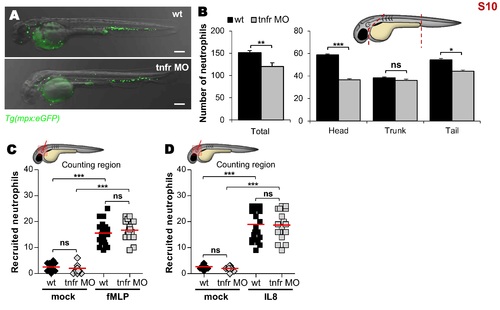
Distribution and mobilization of neutrophils in tnfr1 morphants. (A) Representative bright-field and fluorescence overlay image of WT versus tnfr morphants Tg(mpx:eGFP) embryos at 2 dpf. Scale bars, 200 μm. (B) Quantification of basal number of neutrophils in whole (left) or detailed in the head, in the trunk and tail (right) of 2 dpf embryos (n = 12). Graphs represent the mean ± SEM. (C and D) Mean number of recruited neutrophils into the otic cavity in response to mock, fMLP (C) or IL8 (D) injection in WT and tnfr morphants Tg(mpx:eGFP) embryos monitored at 3 hpi. Each symbol represents an individual embryo and horizontal lines indicate the mean values. Significance was assessed by one-tailed unpaired Student’s t test comparing both embryos per category (B) or by ANOVA with Tukey post-test (C and D). (B-D) Results are representative of two independent experiments. |

