
|
Fig. S10
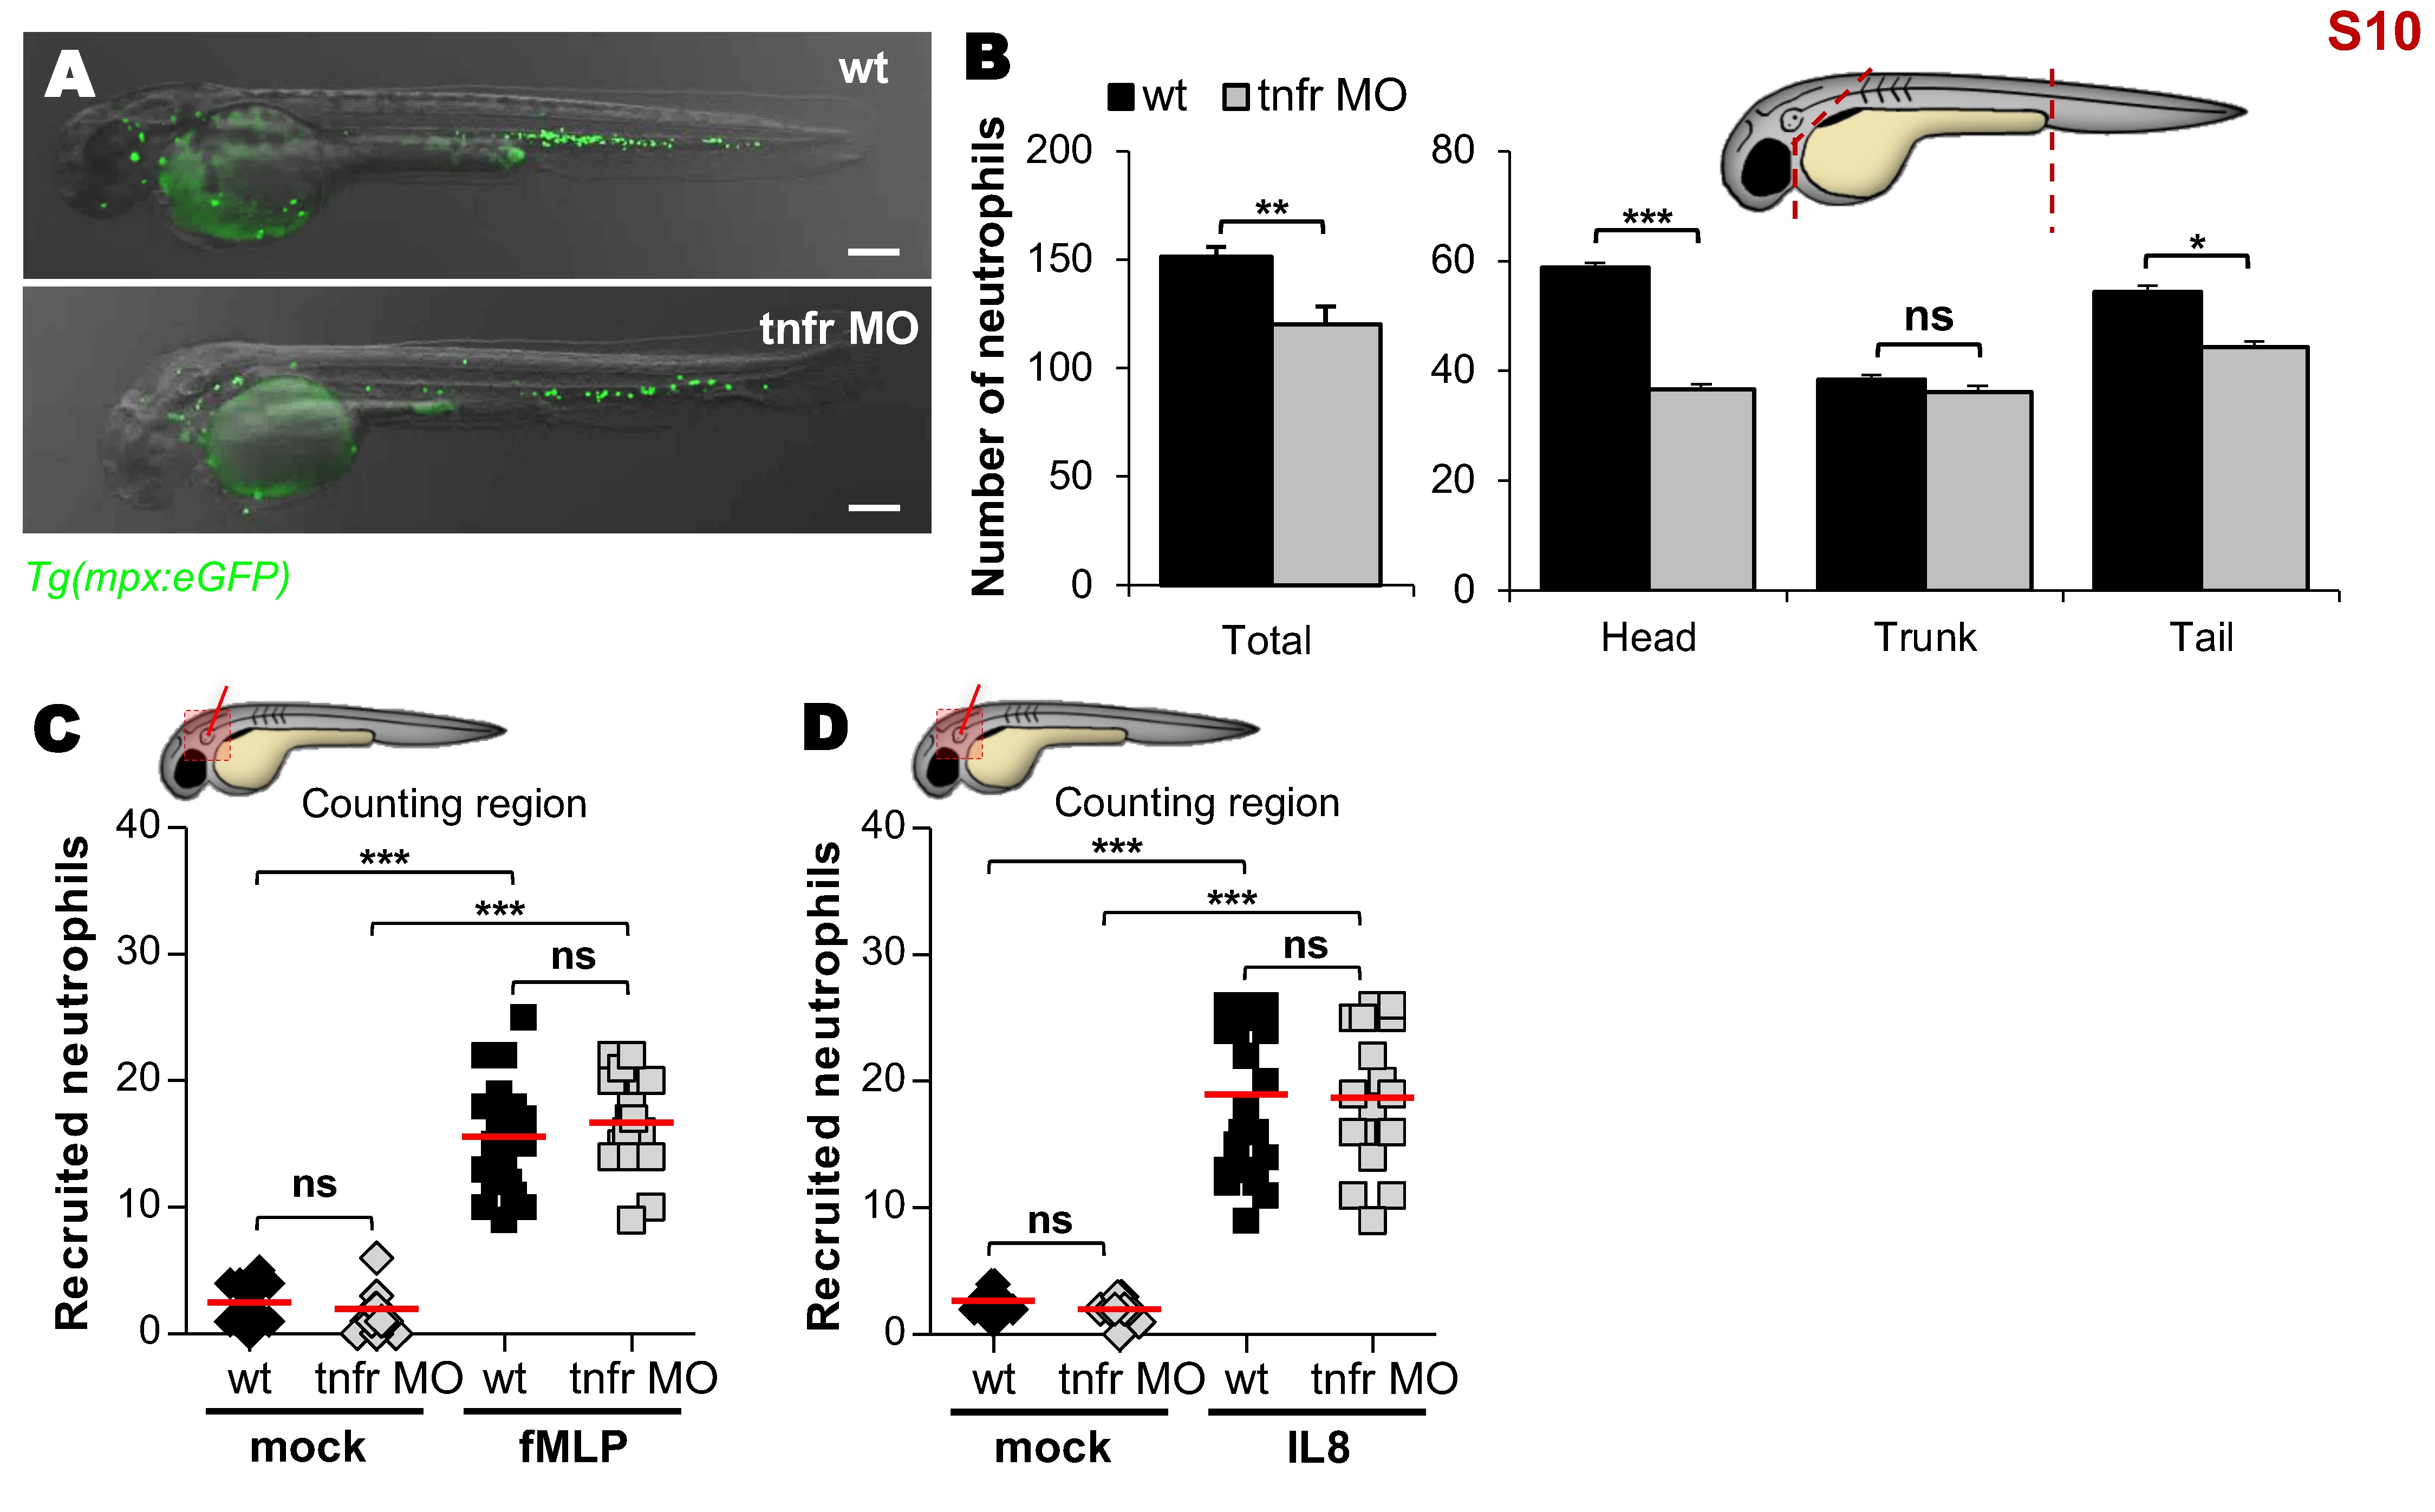
Distribution and mobilization of neutrophils in tnfr1 morphants.
(A) Representative bright-field and fluorescence overlay image of WT versus tnfr morphants Tg(mpx:eGFP) embryos at 2 dpf. Scale bars, 200 μm. (B) Quantification of basal number of neutrophils in whole (left) or detailed in the head, in the trunk and tail (right) of 2 dpf embryos (n = 12). Graphs represent the mean ± SEM. (C and D) Mean number of recruited neutrophils into the otic cavity in response to mock, fMLP (C) or IL8 (D) injection in WT and tnfr morphants Tg(mpx:eGFP) embryos monitored at 3 hpi. Each symbol represents an individual embryo and horizontal lines indicate the mean values. Significance was assessed by one-tailed unpaired Student’s t test comparing both embryos per category (B) or by ANOVA with Tukey post-test (C and D). (B-D) Results are representative of two independent experiments.