
|
Fig. 2
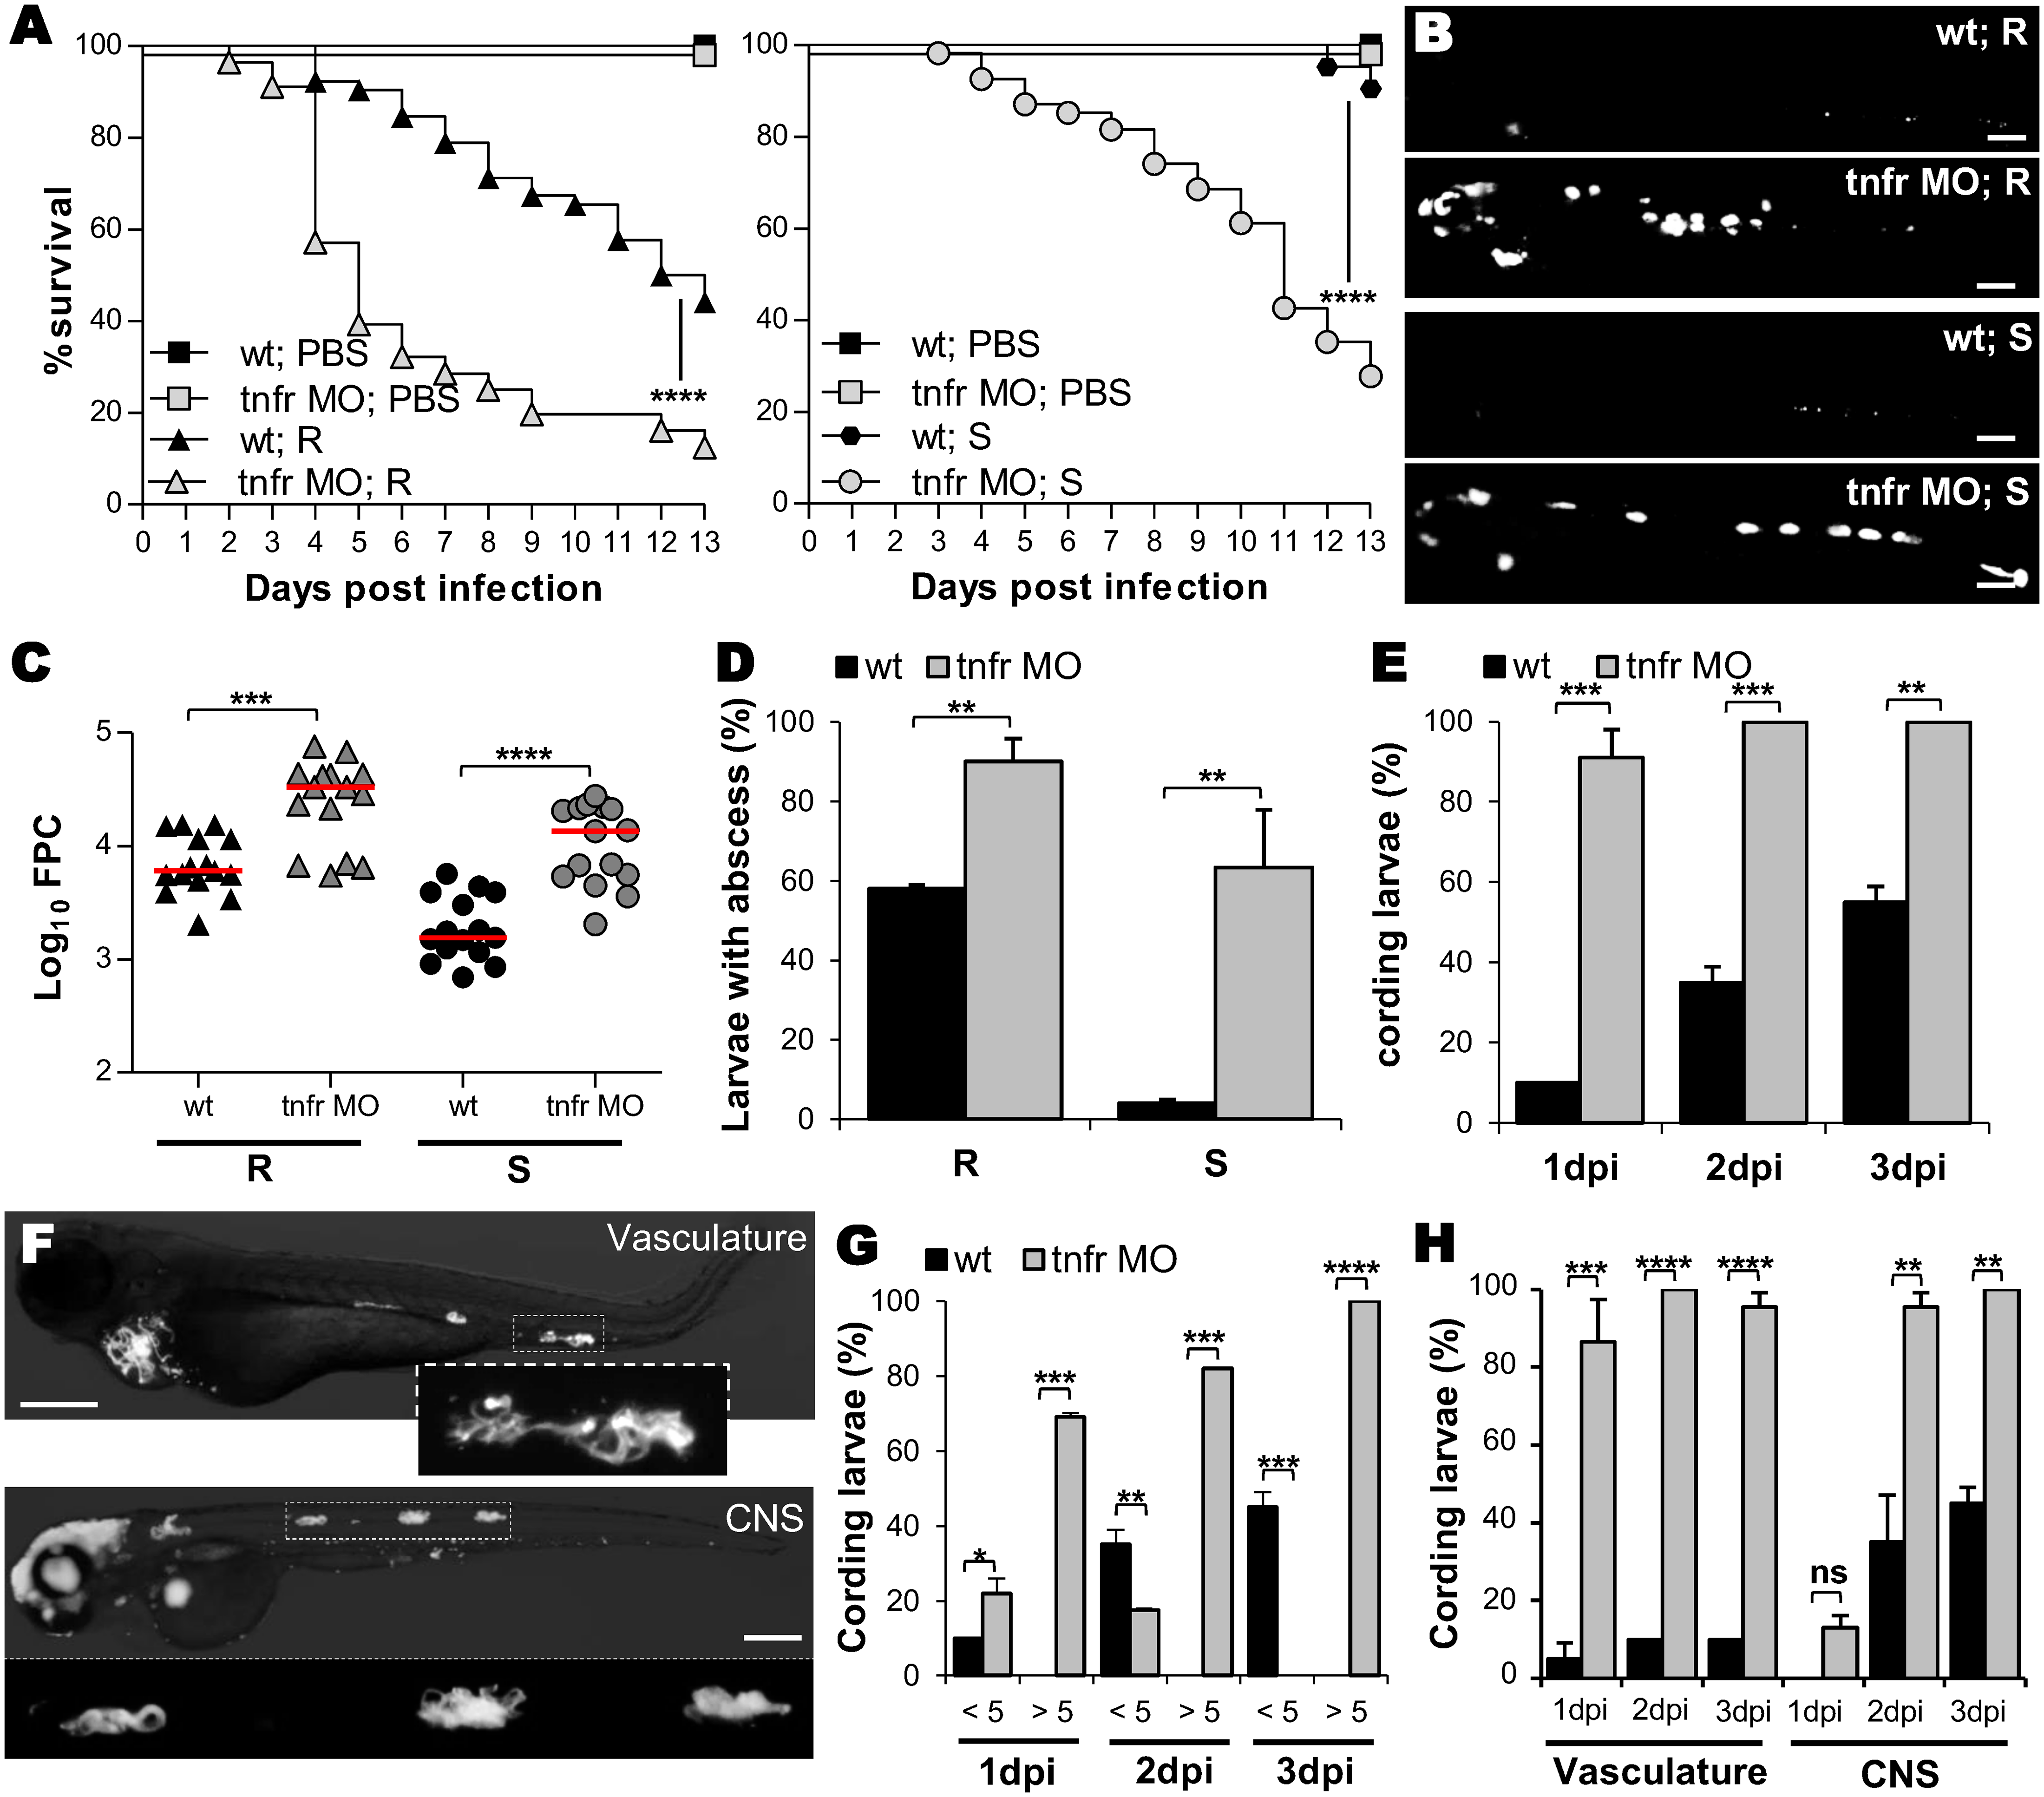
tnfr morphants are highly susceptible to Mabs infections.
(A-H) WT or tnfr morphants were iv infected with either R (A-H) or S (A-D) variants of Mabs (tdTomato, ≈150 CFU). (A) Survival of infected embryos versus PBS-injected embryos (n = 90, average of three independent experiments). (B-C) Representative fluorescence images of: (B) Bacterial loads (FPC, two independent experiments, horizontal lines indicate the median values); (C) 3 dpi embryos infected by either R or S variants. Scale bars, 200 μm. (D) Proportion of larvae with abscesses after 13 dpi expressed as mean ± SEM from two independent experiments (n = 40–50). (E) Kinetic of R-cord formation in whole infected embryos. Mean ± SEM from three independent experiments (n = 30). (F) Fluorescence microscopy of tnfr morphants exhibiting widespread R-cording in the vasculature and in the CNS at 3 dpi. Scale bar, 200μm. (G-H) Proportion of embryos containing <5 or >5 cords (G) and localization of cords (H) in (E). Error bars represent the SEM. Statistical significance was determined by log-rank test (A), one-tailed Mann-Whitney’s t test (C) or Fisher’s exact test of a contingency table (D-E and G-H).