- Title
-
Loss of vhl in the zebrafish pronephros recapitulates early stages of human clear cell renal cell carcinoma
- Authors
- Noonan, H.R., Metelo, A.M., Kamei, C.N., Peterson, R.T., Drummond, I.A., Iliopoulos, O.
- Source
- Full text @ Dis. Model. Mech.
|
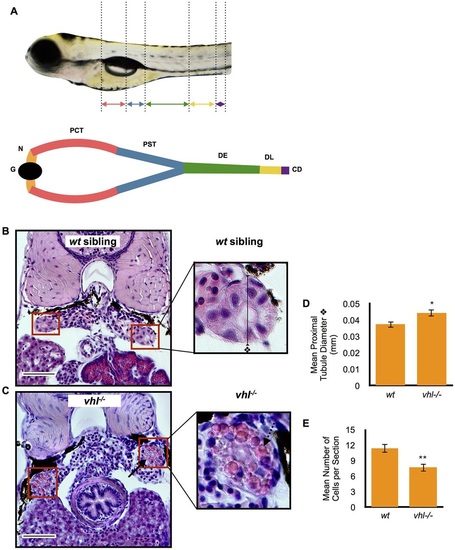
Proximal vhl-/- pronephric tubules have distorted architecture and contain cytoplasmic vesicles when compared to wt siblings. (A) Location of the proximal and distal pronephric tubules in the zebrafish larval pronephric kidney. Kidney segments are color coded. The glomerulus (G, black), neck (N, orange), proximal convoluted tubule (PCT, red), proximal straight tubule (PST, blue), distal early (DE, green), distal late (DL, yellow), collecting duct (CD, purple) are highlighted. (B,C) 5.5dpf vhl-/- and wt siblings were fixed and embedded in JB-4 and sectioned with a glass knife. H&E staining was performed and measurements were taken using ImageJ. H&E staining of wt sibling (B) and vhl-/- (C) proximal pronephric tubules (red boxes). Scale bars: 0.05mm. (D) Diameter (mm) of proximal pronephric tubule in the transverse section. (E) Mean number of cells per transverse section. Each experiment had at least three larvae per sample group and was performed in duplicate. Data represent mean±s.e.m. *P<0.05, **P<0.01 (paired two-tailed t-test). PHENOTYPE:
|
|
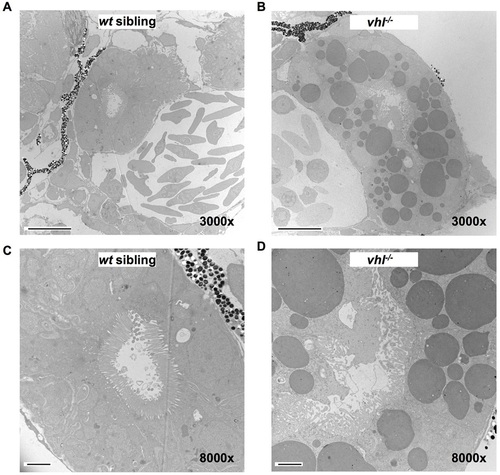
TEM confirms that proximal vhl-/- pronephric tubules have an increased tubule diameter, a distorted lumen, disorganized cilia and contain cytoplasmic lipid vesicles. 5.5dpf vhl-/- and wt siblings were fixed, embedded and sectioned. Thin sections were stained with electron-dense metals and electron microscopy was performed. Transmission electron micrographs of proximal vhl-/- pronephros (B,D) in comparison to wt sibling (A,C). Scale bars: 10µm (A,B); 2µm (C,D). |
|
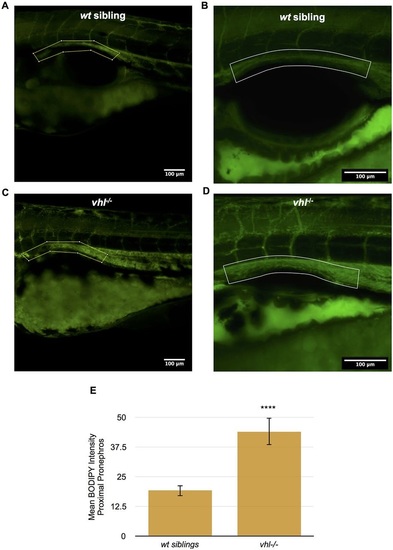
Vhl-/- larvae have an increased amount of lipids in the proximal pronephros compared to wt siblings. (A-D) BODIPY 493/503 immunofluorescence was performed in live whole-mount 5.5dpf vhl-/- and wt siblings. BODIPY 493/503 staining (in green) intensity was then quantified within a ROI encompassing the proximal pronephros (yellow box), using ImageJ. Confocal images of BODIPY staining in vhl-/- (C) versus wt sibling (A). Confocal images of BODIPY staining in vhl-/- (D) versus wt sibling (B). (E) Quantification of mean BODIPY 493/503 staining intensity within the ROI in 5.5dpf vhl-/- versus wt siblings. Each experiment had at least three larvae per sample group and was performed in triplicate. Data represent mean±s.e.m. ****P<0.0001 (paired two-tailed t-test). |
|
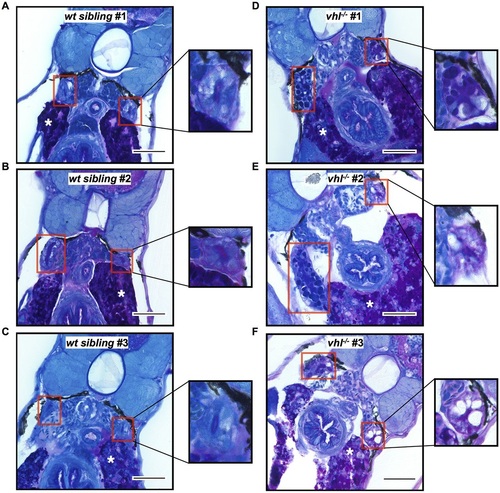
Vhl-/- larvae have increased glycogen content in the proximal pronephros compared to wt siblings. 5.5dpf vhl-/- and siblings were fixed and embedded in JB-4 and sectioned with a glass knife. PAS staining was performed with glycogen stained in purple. PAS staining of wt siblings (A-C) and vhl-/- (D-F) proximal pronephric tubules (red boxes). Asterisks indicate the liver, which serves as a positive control. Scale bars: 0.05mm. Each experiment had at least five larvae per sample group and was performed in duplicate. |
|
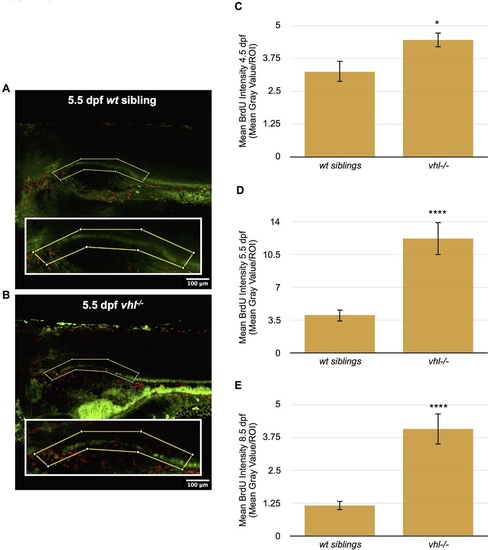
Proximal vhl-/- pronephric tubules have increased cellular proliferation throughout development compared to wt siblings. (A,B) BrdU immunofluorescence was performed in whole-mount 4.5, 5.5 and 8.5dpf Tg(ATPase1.a1A4:GFP) vhl-/- and wt siblings. BrdU staining intensity (red) was then quantified within a ROI (yellow box) encompassing the proximal pronephros (green) using ImageJ. BrdU staining in 5.5dpf wt sibling (A) and vhl-/- (B). (C) Quantification of mean BrdU staining intensity within a ROI in 4.5dpf Tg(ATPase1.a1A4:GFP) vhl-/- versus wt siblings. (D) Quantification of mean BrdU staining intensity within a ROI in 5.5dpf Tg(ATPase1.a1A4:GFP) vhl-/- versus wt siblings. (E) Quantification of mean BrdU staining intensity within a ROI in 8.5dpf Tg(ATPase1.a1A4:GFP) vhl-/- versus wt siblings. Each 4.5dpf experiment had at least nine larvae per sample group and was performed in duplicate. Each 5.5dpf experiment had on average ten larvae per sample group and was performed four times. Each 8.5dpf experiment had 11 larvae per sample group and was performed in duplicate. Data represent mean±s.e.m. *P<0.05, ****P<0.0001 (paired two-tailed t-test). |
|
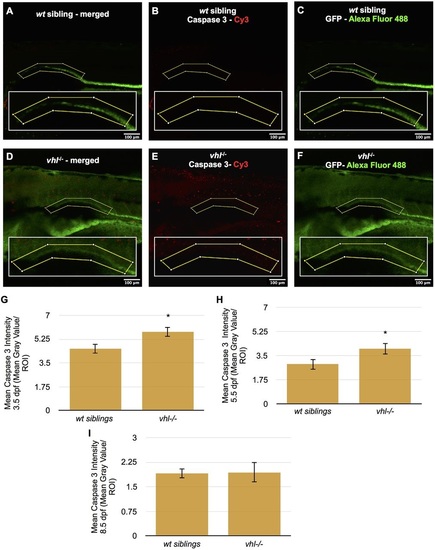
Proximal vhl-/- pronephric tubules have increased cell death at 3.5 and 5.5dpf compared to wt siblings. (A-F) Caspase 3 immunofluorescence was performed in whole-mount 3.5, 5.5 and 8.5dpf Tg(ATPase1.a1A4:GFP) vhl-/- and wt siblings. Caspase 3 staining intensity (red) was then quantified within an ROI (yellow box) encompassing the proximal pronephros (green) using ImageJ. Merged caspase 3 (red) and GFP (green) staining in 5.5dpf wt sibling (A) and vhl-/- (D) larvae. Caspase 3 staining only is shown in 5.5dpf wt sibling (B) and vhl-/- (E). GFP staining only is shown in 5.5dpf wt sibling (C) and vhl-/- (F). (G) Quantification of the mean caspase 3 staining intensity within a ROI in 3.5dpf vhl-/- versus wt siblings, (H) 5.5dpf vhl-/- versus wt siblings and (I) 8.5dpf vhl-/- versus wt siblings. To assist with visualization of caspase 3 staining, the contrast of this image has been adjusted globally using ImageJ software. The quantitative analysis presented was performed on non-enhanced images. Each 3.5, 5.5 and 8.5dpf experiment had ten larvae per sample group and was performed in duplicate. Data represent mean±s.e.m. *P<0.05 (paired two-tailed t-test). EXPRESSION / LABELING:
PHENOTYPE:
|
|
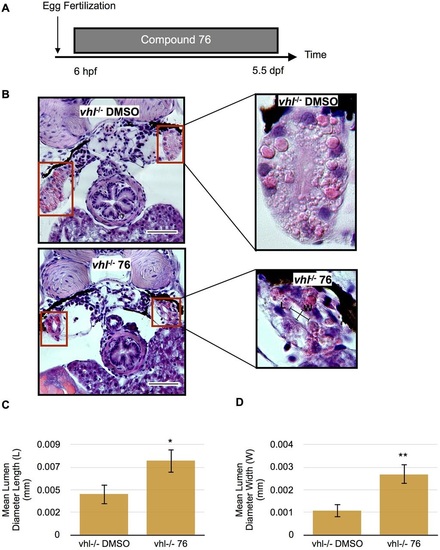
Proximal vhl-/- pronephric tubules exhibit improved phenotype when treated with HIF2a inhibitor Compound 76. (A) Treatment protocol. Vhl-/- embryos were treated with 1µM Compound 76 (76) or DMSO vehicle control from 6hpf to 5.5dpf. (B) H&E staining of 5.5dpf vhl-/- proximal pronephric tubules (red boxes) treated with Compound 76 compared to vhl-/- treated with DMSO vehicle control. Scale bars: 0.05mm. (C) Quantification of mean lumen diameter length (transverse section) in 5.5dpf vhl-/- larvae treated with Compound 76 or DMSO control. (D) Quantification of mean lumen diameter width (transverse section) in 5.5dpf vhl-/- treated with Compound 76 or DMSO control. Each experiment had at least five larvae per sample group and was performed in duplicate. Data represent mean±s.e.m. *P<0.05, **P<0.01 (paired two-tailed t-test). PHENOTYPE:
|
|
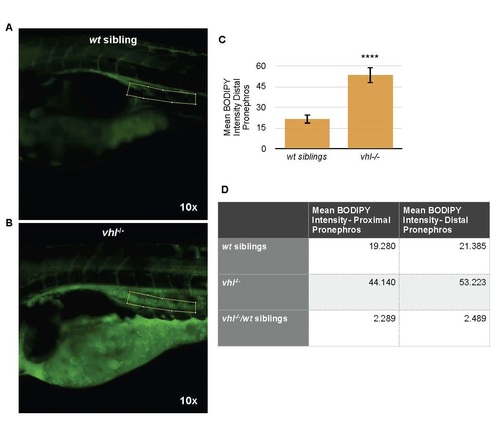
Vhl-/- have an increased amount of lipids in the distal pronephros compared to wt siblings. BODIPY 493/503 immunofluorescence was performed in live whole mount 5.5 dpf vhl-/- and wt siblings. BODIPY 493/503 staining (green) intensity was then quantified within a ROI encompassing the distal pronephros (yellow box), using Image J. (A and B) BODIPY staining in vhl-/- versus wt sibling. Confocal images, 10x magnification. (C) Quantification of mean BODIPY 493/503 staining intensity within the ROI in 5.5 dpf vhl-/- versus wt siblings. (D) Ratio of BODIPY intensity in vhl-/-/wt siblings in both the proximal and distal pronephros. Each experiment had at least 3 larvae per sample group and was performed in triplicate. Data represent mean ± s.e.m. ****P<0.0001. |
|
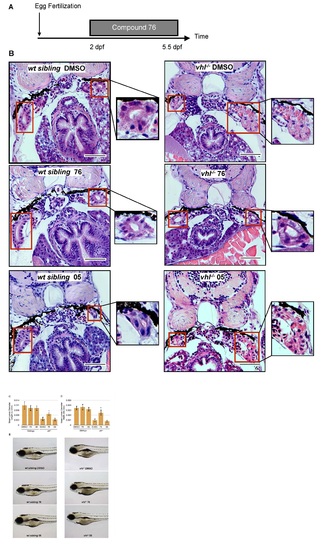
Abnormal phenotype of proximal vhl-/- pronephric tubules is specifically recovered by HIF2a inhibitor Compound 76 and not by the inactive HIF2a inhibitor Compound 05. (A) Treatment protocol. Tg(ATPase1.a1A4:GFP) vhl-/- and wt siblings were treated with 1 µM Compound 76, 05 or DMSO vehicle control from 2 dpf to 5.5 dpf. (B) H&E staining of 5.5 dpf vhl-/- and wt sibling proximal pronephric tubules (red boxes) treated with Compound 76, 05, or DMSO. Magnification is 60x. Scale bars are 0.05 mm long. (C) Quantification of mean lumen diameter length (transverse section) in 5.5 dpf vhl-/- and wt siblings treated with 76, 05, or DMSO control. (D) Quantification of mean lumen diameter width (transverse section) in 5.5 dpf vhl-/- and wt siblings treated with 76, 05, or DMSO control. (E) Overall morphology of 5.5 dpf vhl-/- and wt siblings treated with 76, 05, or DMSO control. Each experiment had at least 5 larvae per sample group and was performed in duplicate. Data represent mean ± s.e.m. *P≤0.05. |

