
|
Fig. 5
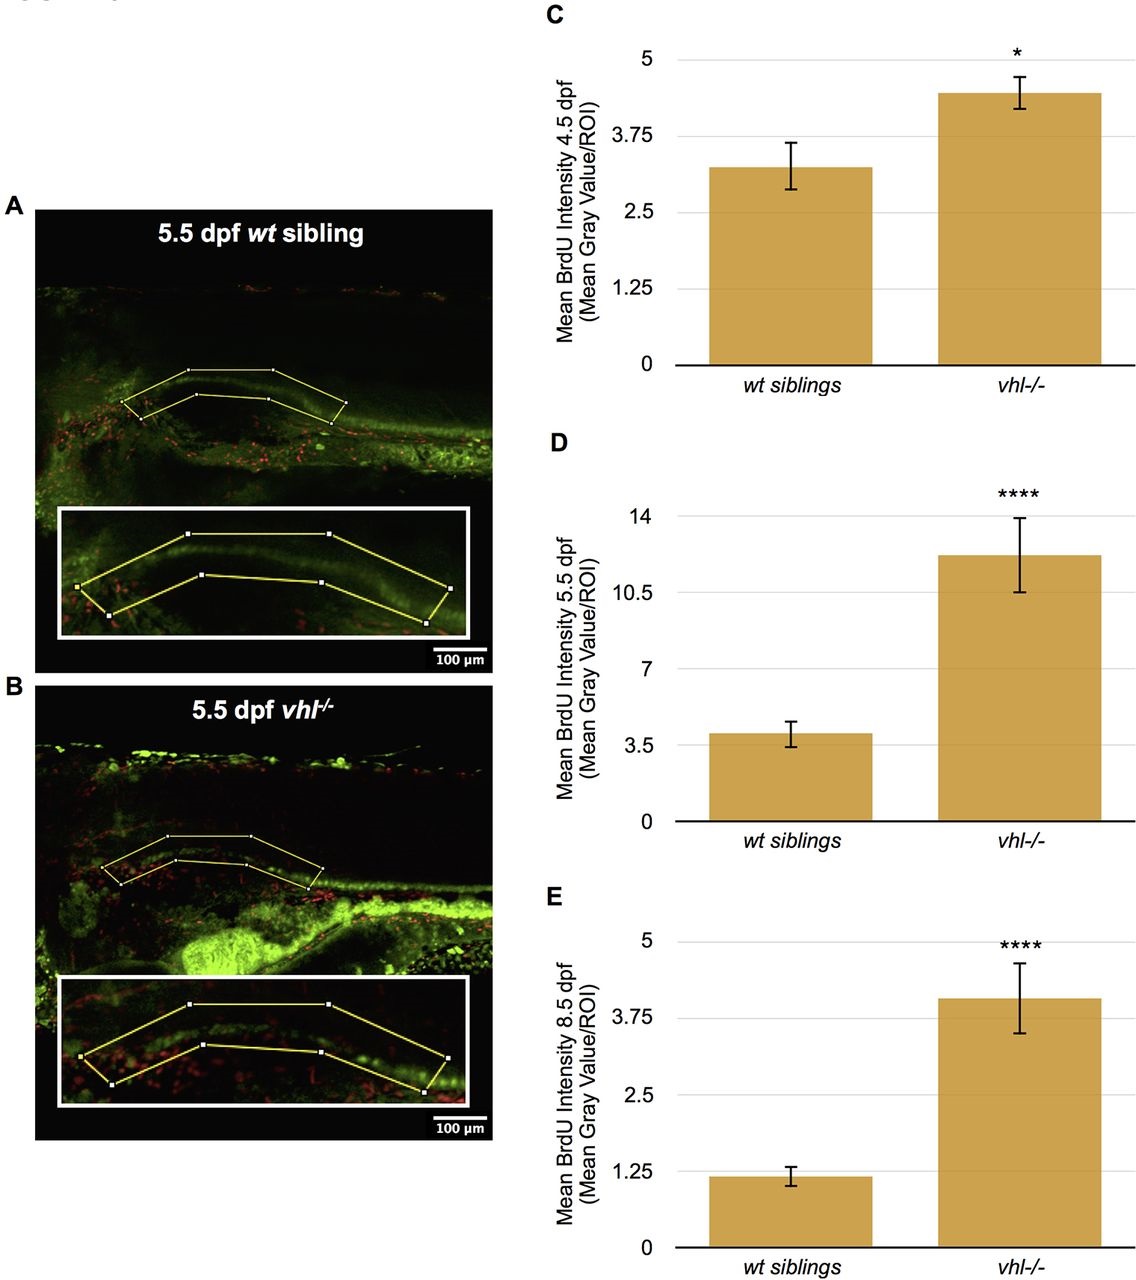
Proximal vhl-/- pronephric tubules have increased cellular proliferation throughout development compared to wt siblings. (A,B) BrdU immunofluorescence was performed in whole-mount 4.5, 5.5 and 8.5dpf Tg(ATPase1.a1A4:GFP) vhl-/- and wt siblings. BrdU staining intensity (red) was then quantified within a ROI (yellow box) encompassing the proximal pronephros (green) using ImageJ. BrdU staining in 5.5dpf wt sibling (A) and vhl-/- (B). (C) Quantification of mean BrdU staining intensity within a ROI in 4.5dpf Tg(ATPase1.a1A4:GFP) vhl-/- versus wt siblings. (D) Quantification of mean BrdU staining intensity within a ROI in 5.5dpf Tg(ATPase1.a1A4:GFP) vhl-/- versus wt siblings. (E) Quantification of mean BrdU staining intensity within a ROI in 8.5dpf Tg(ATPase1.a1A4:GFP) vhl-/- versus wt siblings. Each 4.5dpf experiment had at least nine larvae per sample group and was performed in duplicate. Each 5.5dpf experiment had on average ten larvae per sample group and was performed four times. Each 8.5dpf experiment had 11 larvae per sample group and was performed in duplicate. Data represent mean±s.e.m. *P<0.05, ****P<0.0001 (paired two-tailed t-test).