
- Title
-
Patterning Mechanisms of the Sub-Intestinal Venous Plexus in Zebrafish
- Authors
- Goi, M., Childs, S.J.
- Source
- Full text @ Dev. Biol.
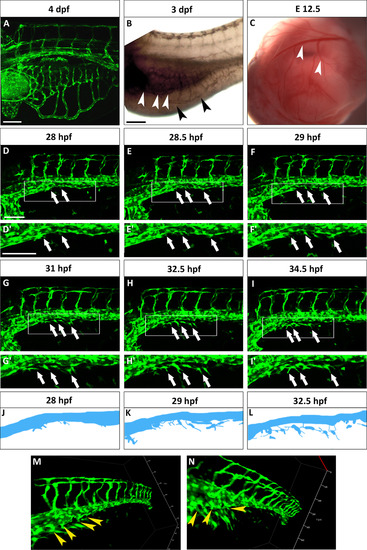
The SIVP originates from the PCV. (A) Lateral view of a Tg(fli:EGFP)y1 zebrafish embryo at 4 dpf. The SIVP is located on the surface of the yolk. (B) In situ hybridization with gata6 shows the position of the endoderm/gut (white arrowheads) in comparison to the outer SIVP basket (black arrowheads) at 3 dpf. (C) Analogous mouse omphalomesenteric vessels (vitelline veins) of the yolk sac of an E12.5 mouse embryo are indicated by white arrowheads. (D–I′) Single images taken from a time-lapse series highlight steps in the genesis of the SIVP. Images are shown for the left side of the embryo (D–E). At around 28 hpf, few cells start sprouting from the vein (white arrows). (F) At 29 hpf, the sprouts start elongating on the yolk ball (white arrows). (G–I) From 31 to 34.5 hpf, the SIVP continues to grow ventrally. (D′–I′ Enlargements of embryos in D–I. (J–L) Schematics corresponding to specific time-lapse images (D′, F′, H′) that clarify the origin of SIVP vessels. (M–N) 3D images of the developing SIVP show sprouts emanating from the vein (yellow arrowheads). Scale bars represent 100 µm. |
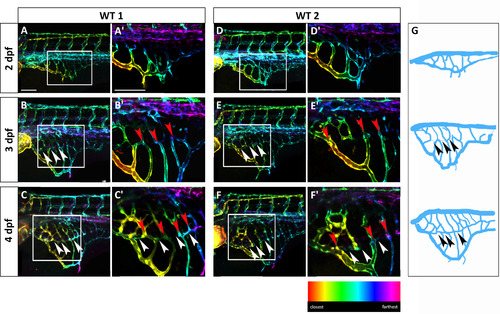
The SIVP vascular pattern is variable among embryos and develops superficial and deep vessel baskets. Depth-coded confocal Z-projections of SIVP development in two individual embryos (A–C′ and D–F′) from 2 to 4 dpf show a similar organization, but small differences in pattern. (A, D) At 2 dpf, the SIVP appears as a single basket on the surface of the yolk. (B, E) At 3 dpf a deeper second vascular basket is visible (the border of the inner basket is indicated by white arrowheads). (C, F) This inner basket becomes more evident at 4 dpf. Some vessels connect both inner and outer vessels (red arrowheads). (A′–F′) Enlargements of images in A–F. (G) Schematics from WT 1 embryo images A–C. Arrowheads indicate the boarder of the inner basket. Scale bars represent 100 µm. |
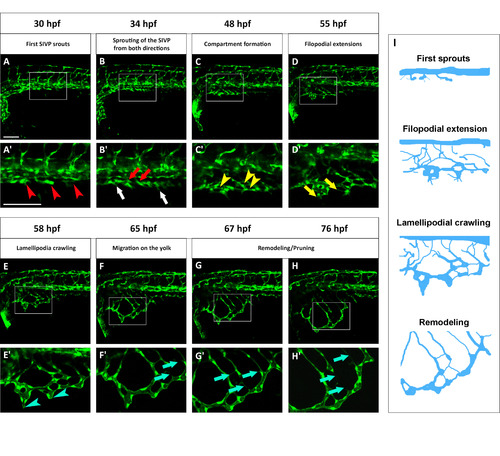
Standardized staging series for SIVP development. Representative confocal micrographs of a time-lapse of SIVP development chosen to show common steps between 30 and 76 hpf. (A′–H′) Enlargements of images below each single original frame. (A′) Red arrowheads indicate the sprouts from the PCV. (B′) Red arrows indicate the sprout from the first SIVP vessel connecting with the supraintestinal artery, located along the midline. White arrows indicate the sprouts from the first SIVP vessel migrating ventrally around the yolk. (C′) Yellow arrowheads point to developing compartments. (D′ Yellow arrows mark the presence of filopodia. (E′) Blue arrowheads show the formation of lamellipodia. (F′–G′–H′) Blue arrows indicate pruning events. (I) Schematics corresponding to key timepoints (A′, D′, E′ and G′) in the progression of SIVP development. Scale bars represent 100 µm. |
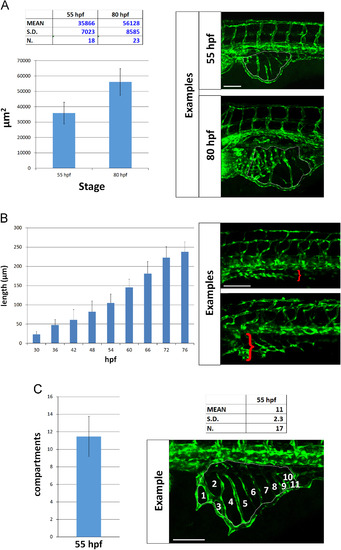
Quantitative analysis of SIVP vessel angiogenesis in wild-type embryos. (A) Measurement of the area of the vessel coverage over the yolk at two different stages. (B) The extent of migration of the SIVP outer basket was tracked from 30 to 76 hpf in multiple embryos. The average values were calculated and plotted in a graph. (C) The mean number of compartments per SIVP was calculated at 55 hpf. Scale bars represent 100 µm. |
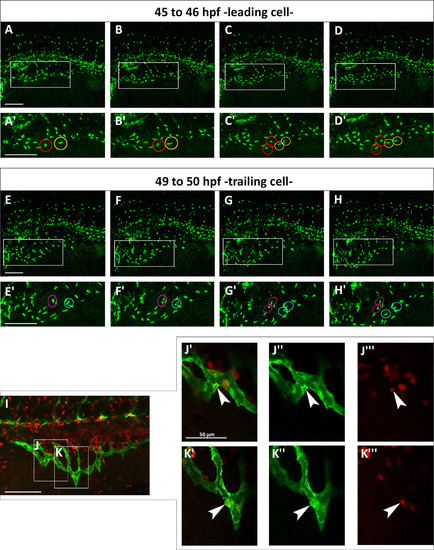
Both leading and trailing cells proliferate during migration. (A–H) Confocal micrographs of a time-lapse of a Tg(fli:EGFP)y7 embryo. (A′–H′) Enlargements are shown below each frame. (A′–D′) Red and yellow circles indicate two proliferating leading cells from about 45 to 46 hpf. (E′–H′) Magenta and blue circles indicate two dividing trailing cells from about 49–50 hpf. (I) Red EdU staining on Tg(fli:EGFP)y1 embryo at 48 hpf. (J–K) Boxes indicate the position of the enlargements from image I. J indicates a trailing cell and K a leading cell. (J′–K′′′) Merge of enlargement of boxes J and K. Endothelial cells are marked green and proliferating nuclei, red. White arrowheads indicate SIVP proliferating cells. Scale bars represent 100 µm. |
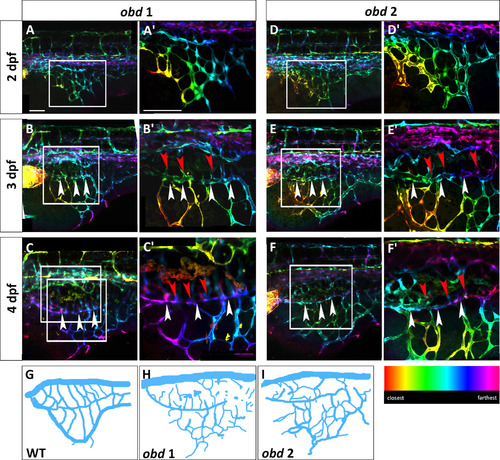
obd mutants have a variable SIVP pattern and SIVP overgrowth. Depth-coded confocal stacks of SIVP development in two individual embryos (A–C2 and D-F2) of obdfov01b; Tg(fli:EGFP)y1 line from 2 to 4 dpf showing variability in SIVP pattern. The border of the inner vascular basket is indicated by white arrowheads. Shared vessels between the inner and outer basket are indicated by red arrowheads. Scale bars represent 100 µm. (G–I) Schematics of SIVP phenotype in wild-type (Fig. 2C), obd 1 ( Fig. 6C) and obd 2 ( Fig. 6F) embryos at 4 dpf. |
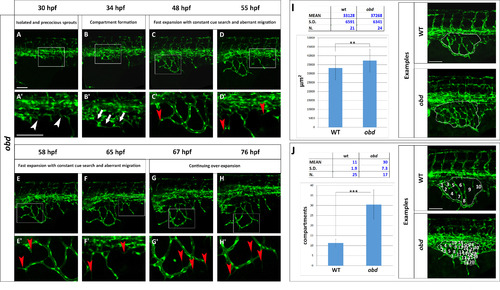
The obd SIVP shows precocious development, constant cue search, aberrant migration and higher number of compartments. (A–H) Confocal micrographs from a time-lapse of a developing obdfov01b; Tg(fli:EGFP)y1 SIVP. (A′–H′) Enlargements of images in A–H. (A′) White arrowheads indicate the precocious development of the SIVP vessels. (B2) White arrows point to some of the developing compartments. (C′–D′-E′-F′) Red arrowheads mark the presence of constant filopodial extension and aberrant migration and sprouting. (G′-H′) Red arrows indicate the formation of new filopodia scanning the environment. No pruning events are visible. (I–J) Quantitative analysis of obd SIVP vessel angiogenesis. (I) Measurement of the area of the vessel coverage over the yolk of wild-type and obd mutant embryos at 55 hpf. J) The mean number of compartments per SIVP in wild-type and obd mutant embryos was calculated at 55 hpf. The average values were calculated and plotted in a graph. **=p≤0.01 and ***=p≤ 0.001 by the Student′s T-Test. Scale bars represent 100 µm. |
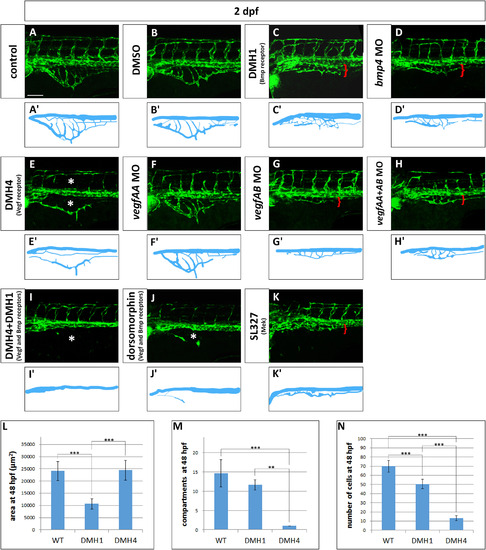
Vegf and Bmp redundantly control SIVP growth. (A–K) Phenotype of embryos treated with small molecule inhibitors from 24 hpf to 48 hpf or morpholinos. (A) Untreated control embryo (B) DMSO treated control embryos. (C) 50 µM DMH1 treated embryo, an inhibitor of the Bmp type I receptor Alk2. (D) bmp4 morphant. (E) 50 µM DMH4 treated embryo, a Vegfr2 inhibitor. (F) vegfaa morphant. (G) vegfab morphant. (H) vegfaa and vegfab double morphants. (I) DMH4 and DMH1 treated embryo at 25 µM each. (J) 50 µM dorsomorphin. (K) 30 µM SL327, a Mek-1/Mek-2 inhibitor. (A′–K′) Schematics corresponding to images above (A–K). Red brackets indicate the reduced expansion of the SIVP and asterisks mark the absence of SIVP internal vessels and ISVs. Scale bar represents 100 µm. (L–N) Measurement of the average area of the vessel coverage over the yolk, number of compartments or number of cells at 48 hpf for wild-type, DMH1 treated and DMH4 treated embryos. **=p≤0.01 and ***=p≤0.001 using ANOVA. |
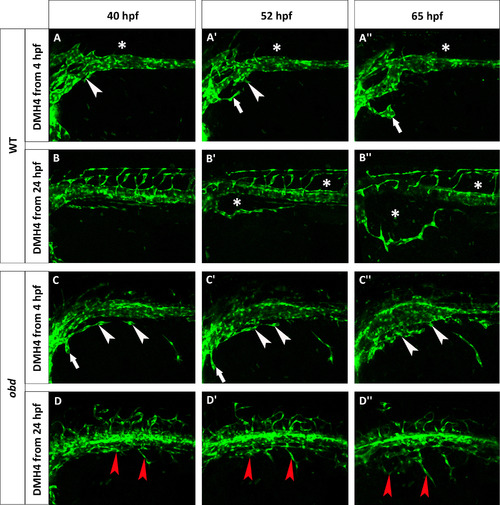
obd mutants are less sensitive to Vegf inhibition. Phenotype of wild-type (A–B′′) and obd (C–D′′) embryos treated with 50 µM DMH4. (A–A′′) A Tg(fli:EGFP)y1 wild-type was treated from 4 hpf and lacks the first SIVP sprouts. White arrowheads point to the attempted sprouts from along the PCV. White arrows indicate an aberrant sprout from the duct of Cuvier. (B–B′′) A Tg(fli:EGFP)y1 wild-type was treated from 24 hpf which stops the formation of SIVP vascular compartments. Asterisks mark the absence of the internal vessels and dysmorphic ISVs. The expansion of the external vessel above the yolk ball is not affected by the inhibition. (C–C′′) obdfov01b; Tg(fli:EGFP)y1 treated embryo from 4 hpf shows some sprouts are present. White arrowheads indicate blocked sprouts from along the vein. White arrows point to irregular sprouts from the duct of Cuvier. (D–D′′) obdfov01b; Tg(fli:EGFP)y1 embryo treated from 24 hpf. Red arrowheads point to residual sprouts. Scale bars represent 100 µm. |
Reprinted from Developmental Biology, 409(1), Goi, M., Childs, S.J., Patterning Mechanisms of the Sub-Intestinal Venous Plexus in Zebrafish, 114-28, Copyright (2016) with permission from Elsevier. Full text @ Dev. Biol.