
|
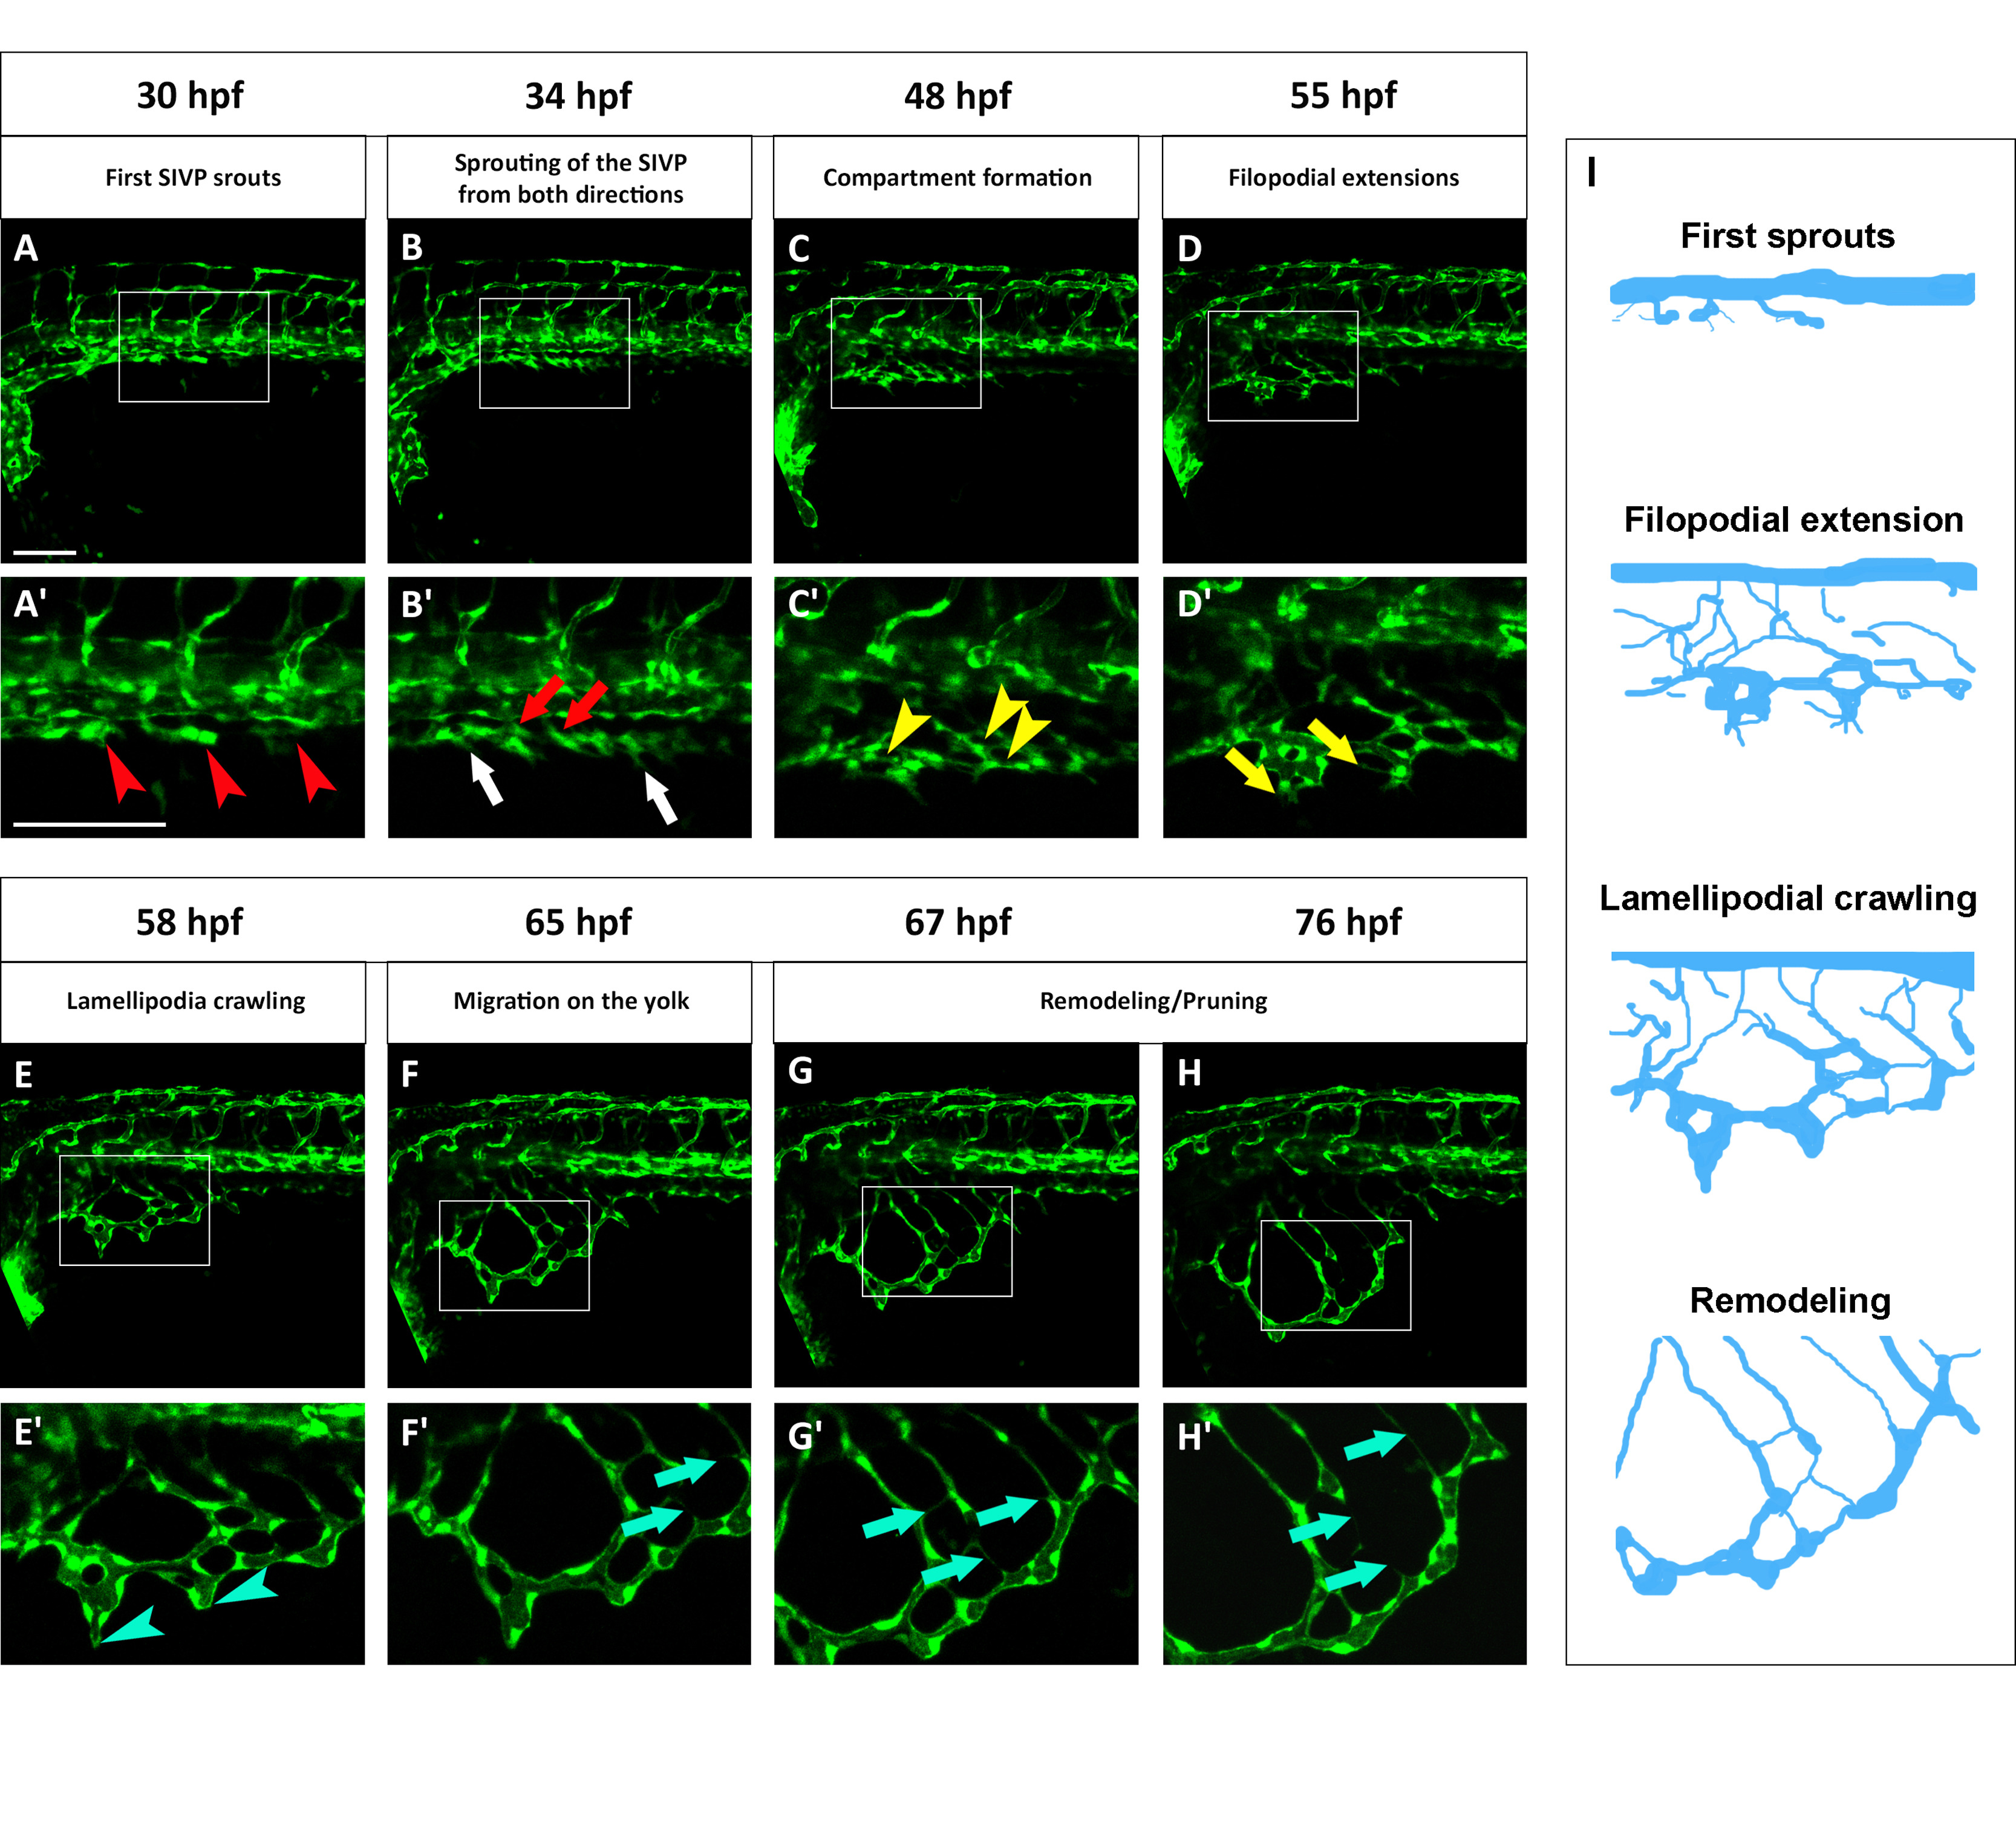
Fig. 3
Standardized staging series for SIVP development. Representative confocal micrographs of a time-lapse of SIVP development chosen to show common steps between 30 and 76 hpf. (A′–H′) Enlargements of images below each single original frame. (A′) Red arrowheads indicate the sprouts from the PCV. (B′) Red arrows indicate the sprout from the first SIVP vessel connecting with the supraintestinal artery, located along the midline. White arrows indicate the sprouts from the first SIVP vessel migrating ventrally around the yolk. (C′) Yellow arrowheads point to developing compartments. (D′ Yellow arrows mark the presence of filopodia. (E′) Blue arrowheads show the formation of lamellipodia. (F′–G′–H′) Blue arrows indicate pruning events. (I) Schematics corresponding to key timepoints (A′, D′, E′ and G′) in the progression of SIVP development. Scale bars represent 100 µm.
Reprinted from Developmental Biology, 409(1), Goi, M., Childs, S.J., Patterning Mechanisms of the Sub-Intestinal Venous Plexus in Zebrafish, 114-28, Copyright (2016) with permission from Elsevier. Full text @ Dev. Biol.