
- Title
-
Hyperspectral light sheet microscopy
- Authors
- Jahr, W., Schmid, B., Schmied, C., Fahrbach, F.O., Huisken, J.
- Source
- Full text @ Nat. Commun.
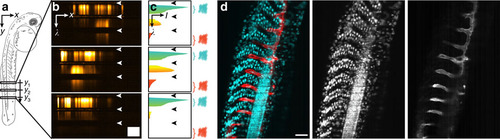
Image formation and virtual filtering. (a) Schematic drawing of a two days post fertilization zebrafish embryo imaged laterally. (b) Typical x, λ-data sets acquired along three different lines in a Tg(h2afva:h2afva-GFP,kdrl:Hsa.HRAS-mCherry) zebrafish embryo. Spatial information is displayed horizontally, spectral information vertically. Dark horizontal stripes (arrowheads) were caused by the QuadNotch filter blocking scattered illumination light. Scale bar, 100nm (spectral) × 100µm (spatial). (c) Spectra were extracted from the x, λ-data sets by integration along the x axis. From the spectra, regions that could be assigned unambiguously to a colour channel were chosen and integrated (′virtual filtering′). (d) Reconstruction of a dual channel image with cyan (left): 475-555nm, red (right): 601-718nm. Scale bar, 100µm. |
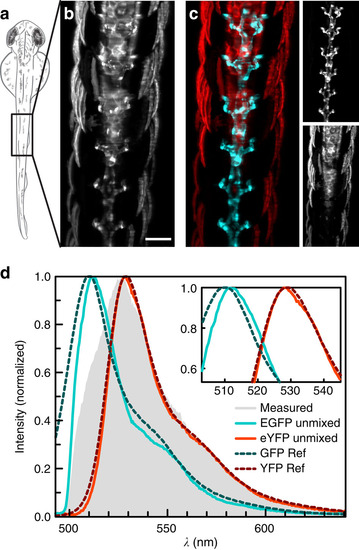
Linear unmixing of EGFP and eYFP. (a) Schematic drawing of a two days post fertilization zebrafish embryo imaged dorsally. (b) Integration of the reconstructed data set from a Tg(kdrl:EGFP,s1013t:Gal4,UAS:ChR2-eYFP) zebrafish along γ. Contributions from EGFP and eYFP could not be distinguished. (c) With linear unmixing, EGFP (cyan) and eYFP (red) were separated and (d) their spectra determined: measured spectrum (grey), EGFP (cyan), eYFP (red). Values from previous studies16 (dashed) are plotted for comparison. Maximum intensity projections of seven planes, z-spacing 10µm. Scale bar, 100µm. |
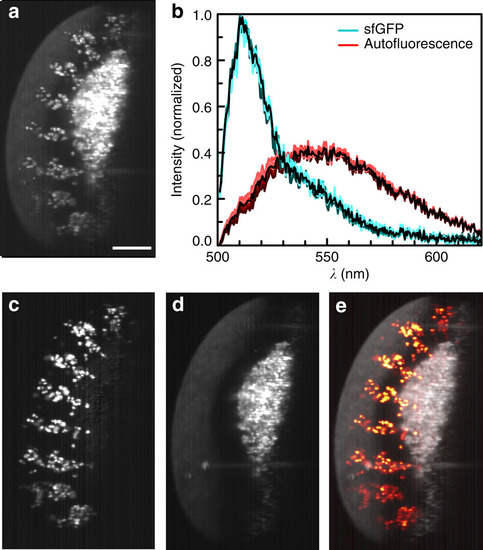
Unmixing of autofluorescence. (a) A λ-stack of 6h post-laying Drosophila expressing sens-sfGFP was integrated between 500 and 570nm to simulate imaging with a standard GFP bandpass filter. Strong autofluorescence in the green spectral region overlapped with the sfGFP signal. (b) Spectra from unmixing: sfGFP (cyan) and autofluorescence (red). Spectra from each plane are plotted in colour, average spectra black. (c) After unmixing for two colours, sfGFP was completely separated and (d) autofluorescence removed. (e) Combination of fluorescence and autofluorescence signals provide additional context, here the outline of the sample. γ-values of the autofluorescence signal were adjusted to 0.1 to make sample outlines better visible. Maximum intensity projections of 13 planes, z-spacing 2µm. Scale bar, 100µm. |
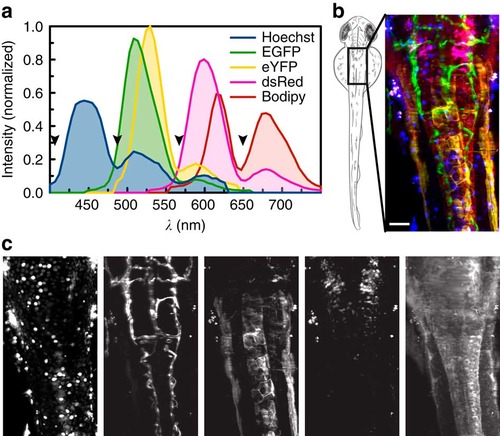
Linear unmixing of five fluorophores. (a) For imaging five colours, wild-type fish stained with Hoechst or Bodipy as well as fish expressing only EGFP, eYFP or dsRed were imaged to obtain reference spectra. Black arrowheads highlight regions where the signal is suppressed by the QuadNotch Filter. (b) A zebrafish embryo expressing Tg(kdrl:EGFP,s1013t:Gal4,UAS:ChR2-eYFP,ptf1a:dsRed) was stained with Hoechst and Bodipy and imaged dorsally. Pseudo-colour overlay after unmixing the hyperspectral data set with reference spectra. For better visualization, Bodipy intensity is reduced to 75%. (c) Individual channels, from left to right: Hoechst (blue), EGFP (green), eYFP (yellow), dsRed (magenta) and Bodipy (red). Maximum intensity projections of 65 planes, z-spacing 2µm. |
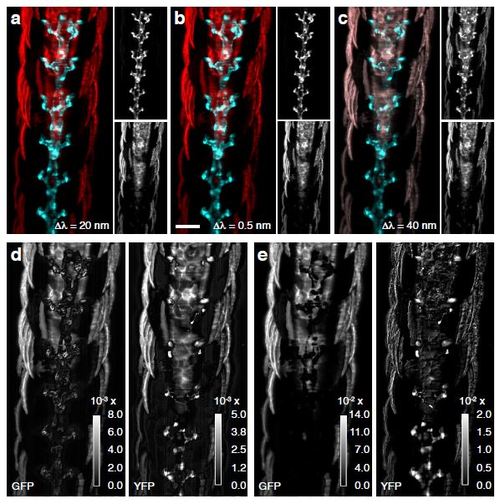
Efficiency of Unmixing. (a) Dual-channel image unmixed from a stack with spectral sampling of 0:5 nm, (b) 20nm and (c) 40 nm. EGFP (cyan), eYFP (red). (d) StD of unmixing results from a stack with spectral sampling of 0:5nm and 20 nm. (e) StD of unmixing results from a stack with spectral sampling of 0:5nm and 40 nm. StD between EGFP channels (left) and eYFP (right). |