
Fig. 4
- ID
- ZDB-FIG-151102-53
- Publication
- Jahr et al., 2015 - Hyperspectral light sheet microscopy
- Other Figures
- All Figure Page
- Back to All Figure Page
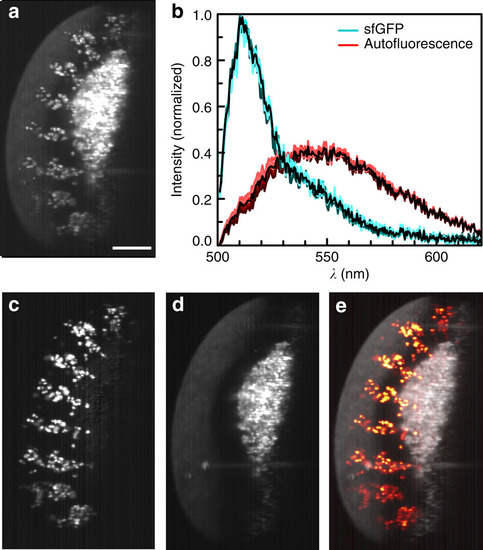
Unmixing of autofluorescence. (a) A λ-stack of 6h post-laying Drosophila expressing sens-sfGFP was integrated between 500 and 570nm to simulate imaging with a standard GFP bandpass filter. Strong autofluorescence in the green spectral region overlapped with the sfGFP signal. (b) Spectra from unmixing: sfGFP (cyan) and autofluorescence (red). Spectra from each plane are plotted in colour, average spectra black. (c) After unmixing for two colours, sfGFP was completely separated and (d) autofluorescence removed. (e) Combination of fluorescence and autofluorescence signals provide additional context, here the outline of the sample. γ-values of the autofluorescence signal were adjusted to 0.1 to make sample outlines better visible. Maximum intensity projections of 13 planes, z-spacing 2µm. Scale bar, 100µm. |