
Fig. 6
- ID
- ZDB-FIG-151102-54
- Publication
- Jahr et al., 2015 - Hyperspectral light sheet microscopy
- Other Figures
- All Figure Page
- Back to All Figure Page
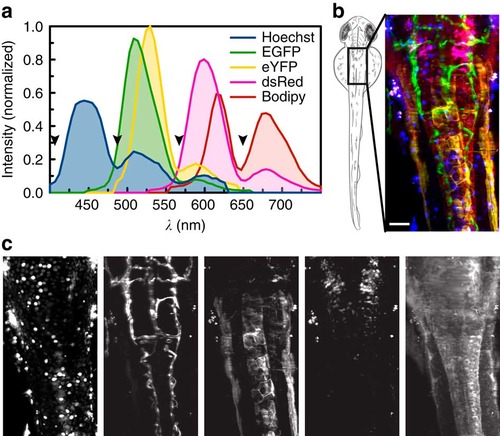
Linear unmixing of five fluorophores. (a) For imaging five colours, wild-type fish stained with Hoechst or Bodipy as well as fish expressing only EGFP, eYFP or dsRed were imaged to obtain reference spectra. Black arrowheads highlight regions where the signal is suppressed by the QuadNotch Filter. (b) A zebrafish embryo expressing Tg(kdrl:EGFP,s1013t:Gal4,UAS:ChR2-eYFP,ptf1a:dsRed) was stained with Hoechst and Bodipy and imaged dorsally. Pseudo-colour overlay after unmixing the hyperspectral data set with reference spectra. For better visualization, Bodipy intensity is reduced to 75%. (c) Individual channels, from left to right: Hoechst (blue), EGFP (green), eYFP (yellow), dsRed (magenta) and Bodipy (red). Maximum intensity projections of 65 planes, z-spacing 2µm. |