
Image
|
Figure Caption
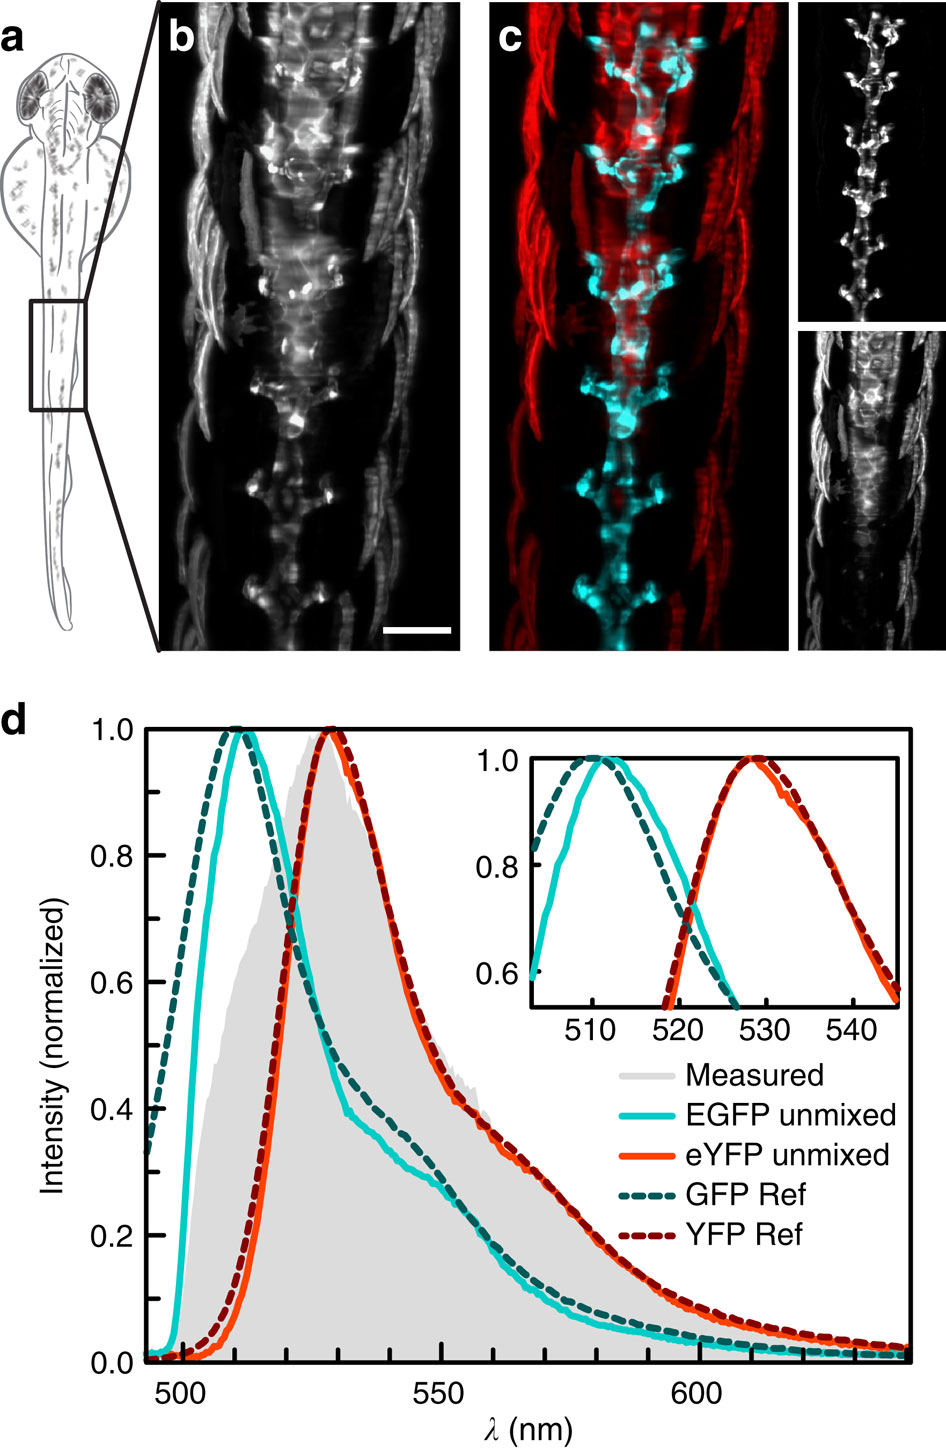
Fig. 3
Linear unmixing of EGFP and eYFP.
(a) Schematic drawing of a two days post fertilization zebrafish embryo imaged dorsally. (b) Integration of the reconstructed data set from a Tg(kdrl:EGFP,s1013t:Gal4,UAS:ChR2-eYFP) zebrafish along γ. Contributions from EGFP and eYFP could not be distinguished. (c) With linear unmixing, EGFP (cyan) and eYFP (red) were separated and (d) their spectra determined: measured spectrum (grey), EGFP (cyan), eYFP (red). Values from previous studies16 (dashed) are plotted for comparison. Maximum intensity projections of seven planes, z-spacing 10µm. Scale bar, 100µm.
Acknowledgments
This image is the copyrighted work of the attributed author or publisher, and
ZFIN has permission only to display this image to its users.
Additional permissions should be obtained from the applicable author or publisher of the image.
Full text @ Nat. Commun.