
- Title
-
Irf4 Regulates the Choice between T Lymphoid-Primed Progenitor and Myeloid Lineage Fates during Embryogenesis
- Authors
- Wang, S., He, Q., Ma, D., Xue, Y., Liu, F.
- Source
- Full text @ Dev. Cell
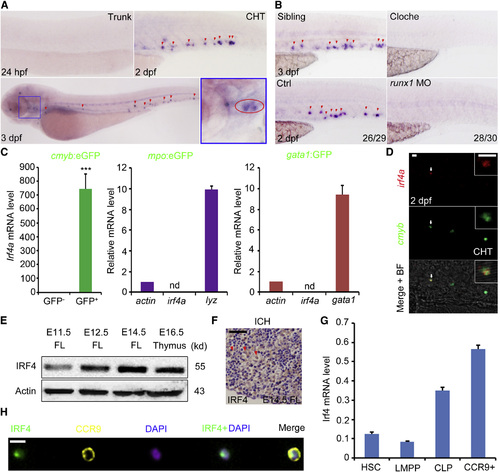
Irf4 Is Expressed in Lymphoid Progenitors at Embryonic Stages (A) Expression pattern of irf4a examined by WISH. The expression of irf4a was observed in the CHT at 2 dpf and later in the thymus at 3 dpf. Red arrows indicate irf4a-expressing cells. The magnified view of the boxed region is shown in the right panel, and the thymus is denoted with red circle. (B) Absence of irf4a expression in the CHT of the cloche mutants and runx1 morphants. (C) qPCR of irf4a in sorted cells from 3-dpf transgenic embryos. Irf4a is highly expressed in cmyb:EGFP+ cells relative to negative cells but is not expressed in mpo:EGFP cells or gata1:GFP cells. The purity of mpo:EGFP cells or gata1:GFP cells was validated by the high expression level of lyz or gata1, respectively, with β-actin as the control. p < 0.001. nd, not detectable. (D) Expression of irf4a in a subset of cmyb-expressing cells in the CHT revealed by double color FISH. The cell denoted by the white arrow is shown in the insets with a magnified view. Scale bar, 20 µm. (E) Western blot showed the protein level of IRF4 in the FL (E11.5, E12.5, and E14.5) or thymus (E16.5) of mouse embryos. (F) Expression of IRF4 in the FL of E14.5 mouse embryos examined by immunochemistry. Red arrows indicate IRF4-expressing cells. Scale bar, 200 µm. (G) qPCR analysis of the relative mRNA level of Irf4 in purified hematopoietic cells from the FL of E13.5 mouse embryos. (H) Expression of IRF4 was observed in CCR9+ cells sorted and photographed using FlowSight (Merck-Millipore). Scale bar, 20 µm. All data are mean ± SD. See also Figure S1 and Table S1. EXPRESSION / LABELING:
PHENOTYPE:
|
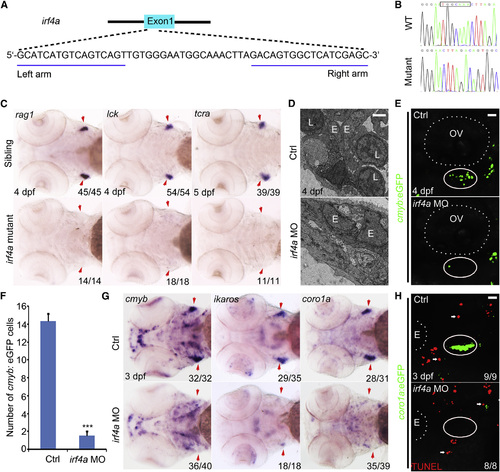
T Cell Development Is Impaired in irf4a-Deficient Embryos (A) Location and sequence of the TALEN target site for the irf4a gene. (B) Sequence flanking the TALEN target site in F2 embryos. The deletion of seven nucleotides is shown in the black box. (C) Expression of rag1, lck, and tcra in the thymus (red arrow) of the siblings and irf4a mutants at 4 or 5 dpf. The embryos for WISH were obtained from an incross of genotyped heterozygous irf4a mutants. (D) Cellular structure of the thymus in the control and irf4a morphants at 4 dpf. The transverse sections were observed with TEM. L, lymphocyte; E, thymic epithelial cells. Scale bar, 2 µm. (E) Confocal images of cmyb:EGFP cells in the thymus of the control or irf4a morphants at 4 dpf. The white circle indicates the thymus region below the otic vesicle (OV), denoted with the white dashed line. Scale bar, 20 µm. (F) Enumeration of cmyb:EGFP cells in the thymus of the control and irf4a morphants at 4 dpf. p < 0.001. (G) Expression of cmyb, ikaros, and coro1a in the thymus (red arrow) of the control and irf4a morphants at 3 dpf. (H) TUNEL assay of the control and irf4a morphants at 3 dpf. The irf4a MOatg was injected into coro1a:EGFP transgenic embryos. The white circle indicates the thymus region behind the eye (E), denoted with the white dashed line. White arrows denote apoptotic cells. Scale bar, 40 µm. All data are mean ± SD. See also Figure S2. EXPRESSION / LABELING:
PHENOTYPE:
|
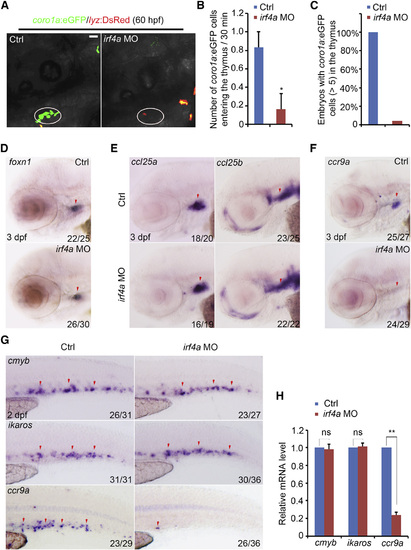
Homing Process Is Disturbed due to the Reduced Expression of ccr9a (A) Confocal imaging of coro1a:EGFP/lyz:DsRed embryos showing no coro1a:EGFP cells in the thymus (white circle) in irf4a morphants. Scale bar, 40 µm. (B) Number of coro1a:EGFP cells entering the thymus every 30 min in the control and irf4a morphants (n = 6) during the homing process. p < 0.05. (C) Quantification of embryos with coro1a:EGFP cells (>5) in the thymus of the control (n = 88) and irf4a morphants (n = 92) at 3.5 dpf. (D) Expression of foxn1 in the control and irf4a morphants at 3 dpf. (E) Expression of ccl25a and ccl25b in the control and irf4a morphants at 3 dpf. (F) Expression of ccr9a in the control and irf4a morphants at 3 dpf. Red arrows indicate the thymus or perithymic region. (G) Expression of cmyb, ikaros, and ccr9a in the CHT of the control and irf4a morphants at 2 dpf. Red arrows indicate hematopoietic progenitors expressing cmyb, ikaros, or ccr9a in the CHT region. (H) qPCR analysis of cmyb, ikaros, and ccr9a in the control and irf4a morphants at 2 dpf. ns, not significant. p < 0.01. All data are mean ± SD. See also Figure S3 and Movie S1. EXPRESSION / LABELING:
PHENOTYPE:
|
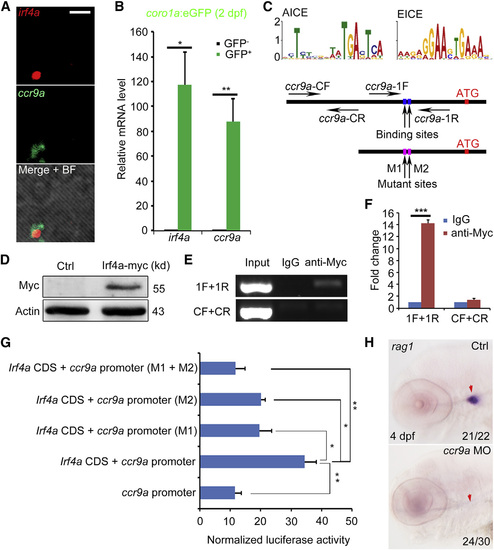
ccr9a Is a Direct Target of Irf4a (A) Co-expression of irf4a and ccr9a in the CHT of 2-dpf embryos revealed by double color FISH. Scale bar, 100 µm. (B) qPCR of irf4a and ccr9a in GFP+ cells relative to negative cells sorted from coro1a:EGFP transgenic embryos at 2 dpf. p < 0.05; p < 0.01. (C) Schematic diagram of the ChIP and reporter assay. The ccr9a-CF and CR are the control forward and reverse primers, which are used to amplify the ccr9a promoter region without the conserved Irf4 binding site. The ccr9a-1F and 1R represent primers used to amplify the promoter region with two conserved Irf4 binding sites within 500 bp upstream of 5′-ATG-3′. AICE, AP-1-IRF composite elements; EICE, Ets-IRF composite elements. (D) Myc was detected in embryos injected with irf4a-myc mRNA by western blot. (E) Direct binding of ccr9a promoter by Irf4a examined by ChIP assay. (F) qPCR of DNA fragments obtained from ChIP assay with primers (ccr9a-1F, 1R or CF, CR). p < 0.001. (G) Reporter assay showed the regulation of ccr9a promoter by Irf4a full-length CDS. M1 indicates that 5′-TGAT-3′ within AICE was mutated to 5′-GTCG-3′, and M2 indicates that 5′-GGAA-3′ within EICE was mutated to 5′-TTCC-3′. p < 0.01; p < 0.05. (H) Expression of rag1 in the thymus (red arrow) of the control and ccr9a morphants at 4 dpf. All data are mean ± SD. See also Figure S4 and Table S2. |
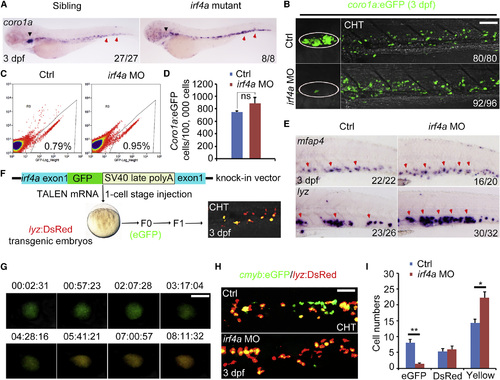
Irf4a-Deficient Lymphoid Progenitors Turn to Myeloid Cells (A) Expression of coro1a in the siblings and irf4a mutants at 3 dpf. The black arrowhead indicates the thymus, and the red arrow indicates the coro1a-expressing cell in the CHT. (B) Confocal images of coro1a:EGFP cells in the thymus (white circle) and CHT of the control and irf4a morphants at 3 dpf. Scale bar, 80 µm. (C) Representative FACS analysis of whole-body coro1a:EGFP cells in the control and irf4a morphants at 3 dpf. (D) Enumeration of whole-body coro1a:EGFP cells shown in (C). Data are representative of three independent experiments (n = 180). ns, not significant. (E) Expression of mfap4 and lyz in the CHT of the control and irf4a morphants at 3 dpf. Red arrows indicate myeloid cells expressing mfap4 or lyz. (F) Brief diagram of irf4a knockin construct and generation of transgenic line for single-cell tracing. (G) Time-lapse imaging of the conversion of the irf4a-deficient cell with EGFP knockin to express lyz:DsRed in the CHT from 58 to 66 hpf. Scale bar, 10 µm. (H) Confocal images of cmyb:EGFP/lyz:DsRed embryos showing cmyb:EGFP, lyz:DsRed, or yellow cells in the CHT of the control or irf4a morphants at 3 dpf. Scale bar, 40 µm. (I) Enumeration of cmyb:EGFP, lyz:DsRed, or yellow cells shown in (H). p < 0.01; p < 0.05. All data are mean ± SD. See also Figure S5 and Movie S2. EXPRESSION / LABELING:
PHENOTYPE:
|

ZFIN is incorporating published figure images and captions as part of an ongoing project. Figures from some publications have not yet been curated, or are not available for display because of copyright restrictions. EXPRESSION / LABELING:
PHENOTYPE:
|
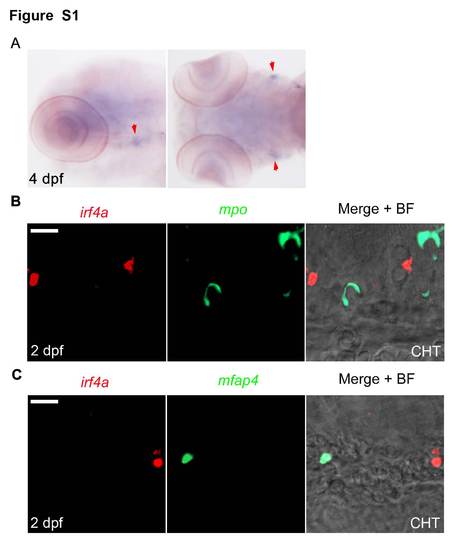
Irf4a is expressed in T-lineage cells but not myeloid cells. (A) The expression of irf4a in zebrafish embryo at 4 dpf by whole-mount in situ hybridization (WISH). The red arrows indicate the thymus. (B) Double color fluorescence in situ hybridization (FISH) showed in 2 dpf embryos the expression of irf4a and mpo (a neutrophil marker) in distinct cells in the caudal hematopoietic tissue (CHT). Scale bar, 20 µm. (C) Double color FISH showed in 2 dpf embryos the expression of irf4a and mfap4 (a macrophage marker) in distinct cells in the CHT. Scale bar, 20 µm. |
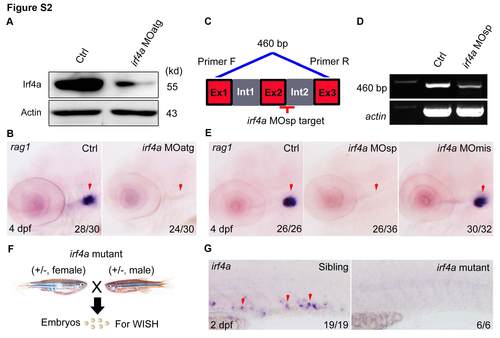
Validation of irf4a morpholinos and mutant. (A) The protein level of Irf4a in the control and irf4a MOatg at 2 dpf examined by western blot. (B) Expression of rag1 in the control and irf4a MOatg at 4 dpf examined by WISH. Red arrows indicate the thymus. (C) The schematic diagram for the evaluation of irf4a splice morpholino. The target of irf4a splice morpholino is denoted with red marker. (D) The amplification of 460 bp products by RT-PCR analysis on cDNA from 2 dpf embryos. Compared to the control, irf4a MOsp injected embryos showed reduced 460 bp PCR products. (E) Expression of rag1 in the control and embryos injected with splice morpholino or mismatch morpholino at 4 dpf. Red arrows indicate the thymus. (F) The schematic diagram of the preparation of irf4a mutant embryos. The embryos were obtained by an incross of genotyped heterozygous irf4a mutant and examined by WISH. (G) Expression of irf4a in the sibling and irf4a mutant at 2 dpf. Red arrows indicate irf4a-expressing cells in the CHT. |
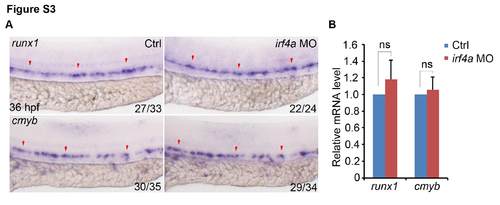
Expression of HSC markers was not affected in irf4a morphants at 36 hpf. (A) Expression of runx1 and cmyb in the control and irf4a morphants at 36 hpf examined by WISH. Red arrows indicate HSCs in the aorta-gonad-mesonephros region. (B) qPCR analysis of runx1 and cmyb in the control and irf4a morphants at 36 hpf. ns, not significant. All data are means ± SD. |
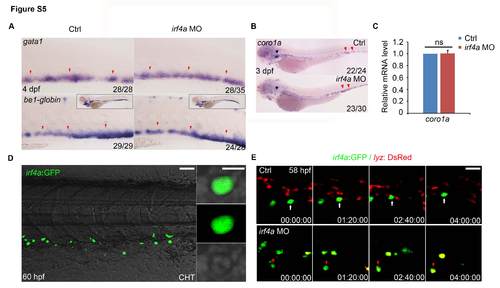
Knockdown of irf4a turns irf4a-expressing lymphoid cells to lyz-expressing myeloid cells without affecting erythroid lineage. (A) The expression of erythroid cells markers, gata1 and βe1-globin in the control and irf4a morphants at 4 dpf. The red arrows indicate cells expressing gata1 or βe1-globin. (B) The expression of coro1a in the control and irf4a morphants at 3 dpf examined by WISH. Black arrowhead indicates the thymus and red arrow indicates coro1a-expressing cells in the CHT. (C) qPCR analysis of coro1a expression in the control and irf4a morphants at 3 dpf. ns, not significant. (D) Confocal images of irf4a-expressing cells in the CHT region of the irf4a:GFP transgenic embryos at 60 hpf (scale bar, 80 µm). The magnified view of irf4a-expressing cell is shown in the right panels (scale bar, 10 µm). (E) Still images of a time-lapse imaging of double transgenic (irf4a:GFP/ lyz:DsRed) wild-type and irf4a morpholino injected embryos. The time-lapse series begins at 58 hpf. White or red arrows indicate the same cell in the control or irf4a morphants respectively (scale bar, 40 µm). All data are means ± SD. |
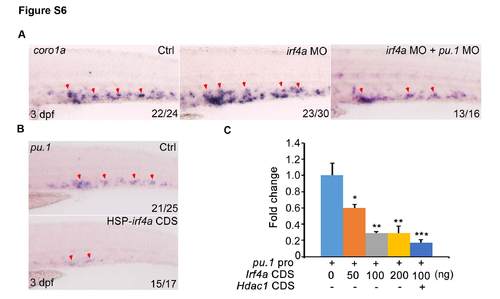
The increase of coro1a+ cells in the CHT of irf4a morphants is pu.1 dependent. (A) The expression of coro1a in the CHT of the control, irf4a morphants and irf4a + pu.1 morphants at 3 dpf examined by WISH. Red arrows indicate coro1a-expressing cells in the CHT. (B) The expression of pu.1 in the CHT region of the control and embryos injected with HSP-Irf4a CDS examined by WISH. Red arrows indicate pu.1-expressing cells in the CHT. (C) Reporter assay showed the regulation of pu.1 promoter by Irf4a CDS. Pu.1 pro indicates the promoter of pu.1 with Irf4 binding site used in ChIP assay (Figure 6D). * p<0.05, ** p<0.01,*** p<0.001. All data are means ± SD. |
Reprinted from Developmental Cell, 34(6), Wang, S., He, Q., Ma, D., Xue, Y., Liu, F., Irf4 Regulates the Choice between T Lymphoid-Primed Progenitor and Myeloid Lineage Fates during Embryogenesis, 621-31, Copyright (2015) with permission from Elsevier. Full text @ Dev. Cell