
Image
|
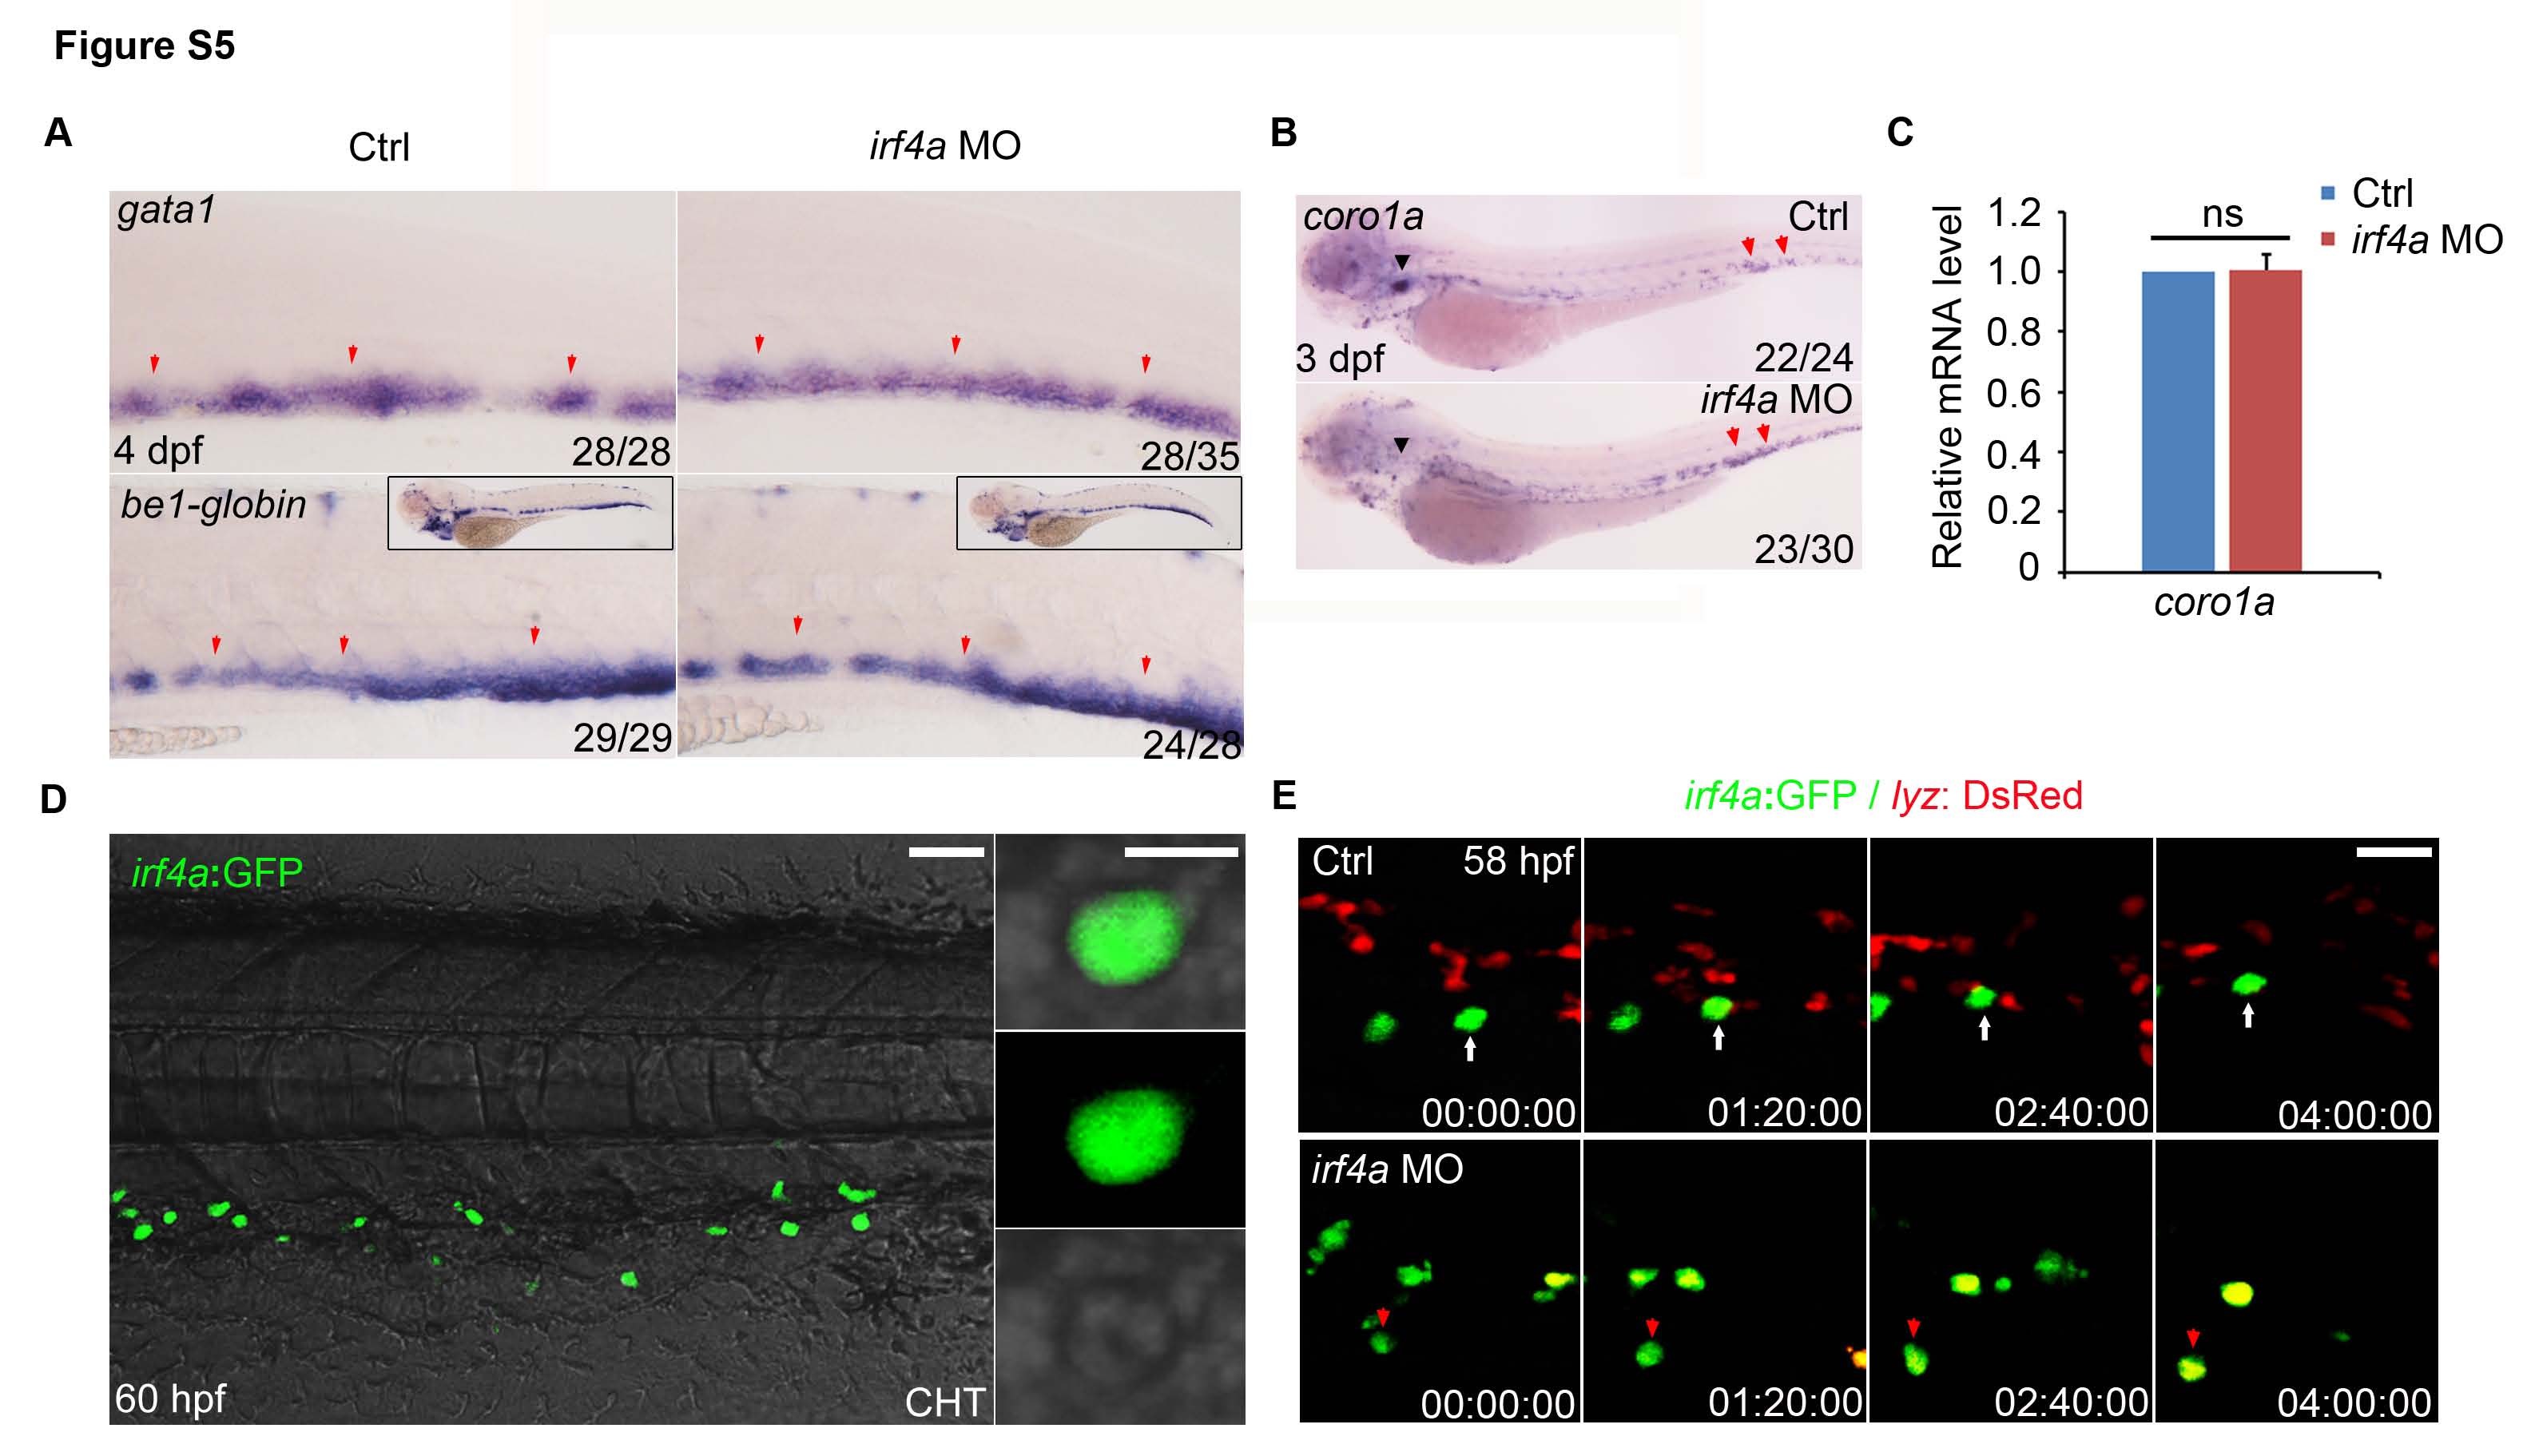
Figure Caption
Fig. S5
Knockdown of irf4a turns irf4a-expressing lymphoid cells to lyz-expressing myeloid cells without affecting erythroid lineage.
(A) The expression of erythroid cells markers, gata1 and βe1-globin in the control and irf4a morphants at 4 dpf. The red arrows indicate cells expressing gata1 or βe1-globin. (B) The expression of coro1a in the control and irf4a morphants at 3 dpf examined by WISH. Black arrowhead indicates the thymus and red arrow indicates coro1a-expressing cells in the CHT. (C) qPCR analysis of coro1a expression in the control and irf4a morphants at 3 dpf. ns, not significant. (D) Confocal images of irf4a-expressing cells in the CHT region of the irf4a:GFP transgenic embryos at 60 hpf (scale bar, 80 µm). The magnified view of irf4a-expressing cell is shown in the right panels (scale bar, 10 µm). (E) Still images of a time-lapse imaging of double transgenic (irf4a:GFP/ lyz:DsRed) wild-type and irf4a morpholino injected embryos. The time-lapse series begins at 58 hpf. White or red arrows indicate the same cell in the control or irf4a morphants respectively (scale bar, 40 µm). All data are means ± SD.
Acknowledgments
This image is the copyrighted work of the attributed author or publisher, and
ZFIN has permission only to display this image to its users.
Additional permissions should be obtained from the applicable author or publisher of the image.
Reprinted from Developmental Cell, 34(6), Wang, S., He, Q., Ma, D., Xue, Y., Liu, F., Irf4 Regulates the Choice between T Lymphoid-Primed Progenitor and Myeloid Lineage Fates during Embryogenesis, 621-31, Copyright (2015) with permission from Elsevier. Full text @ Dev. Cell