
Fig. 5
|
Fig. 5
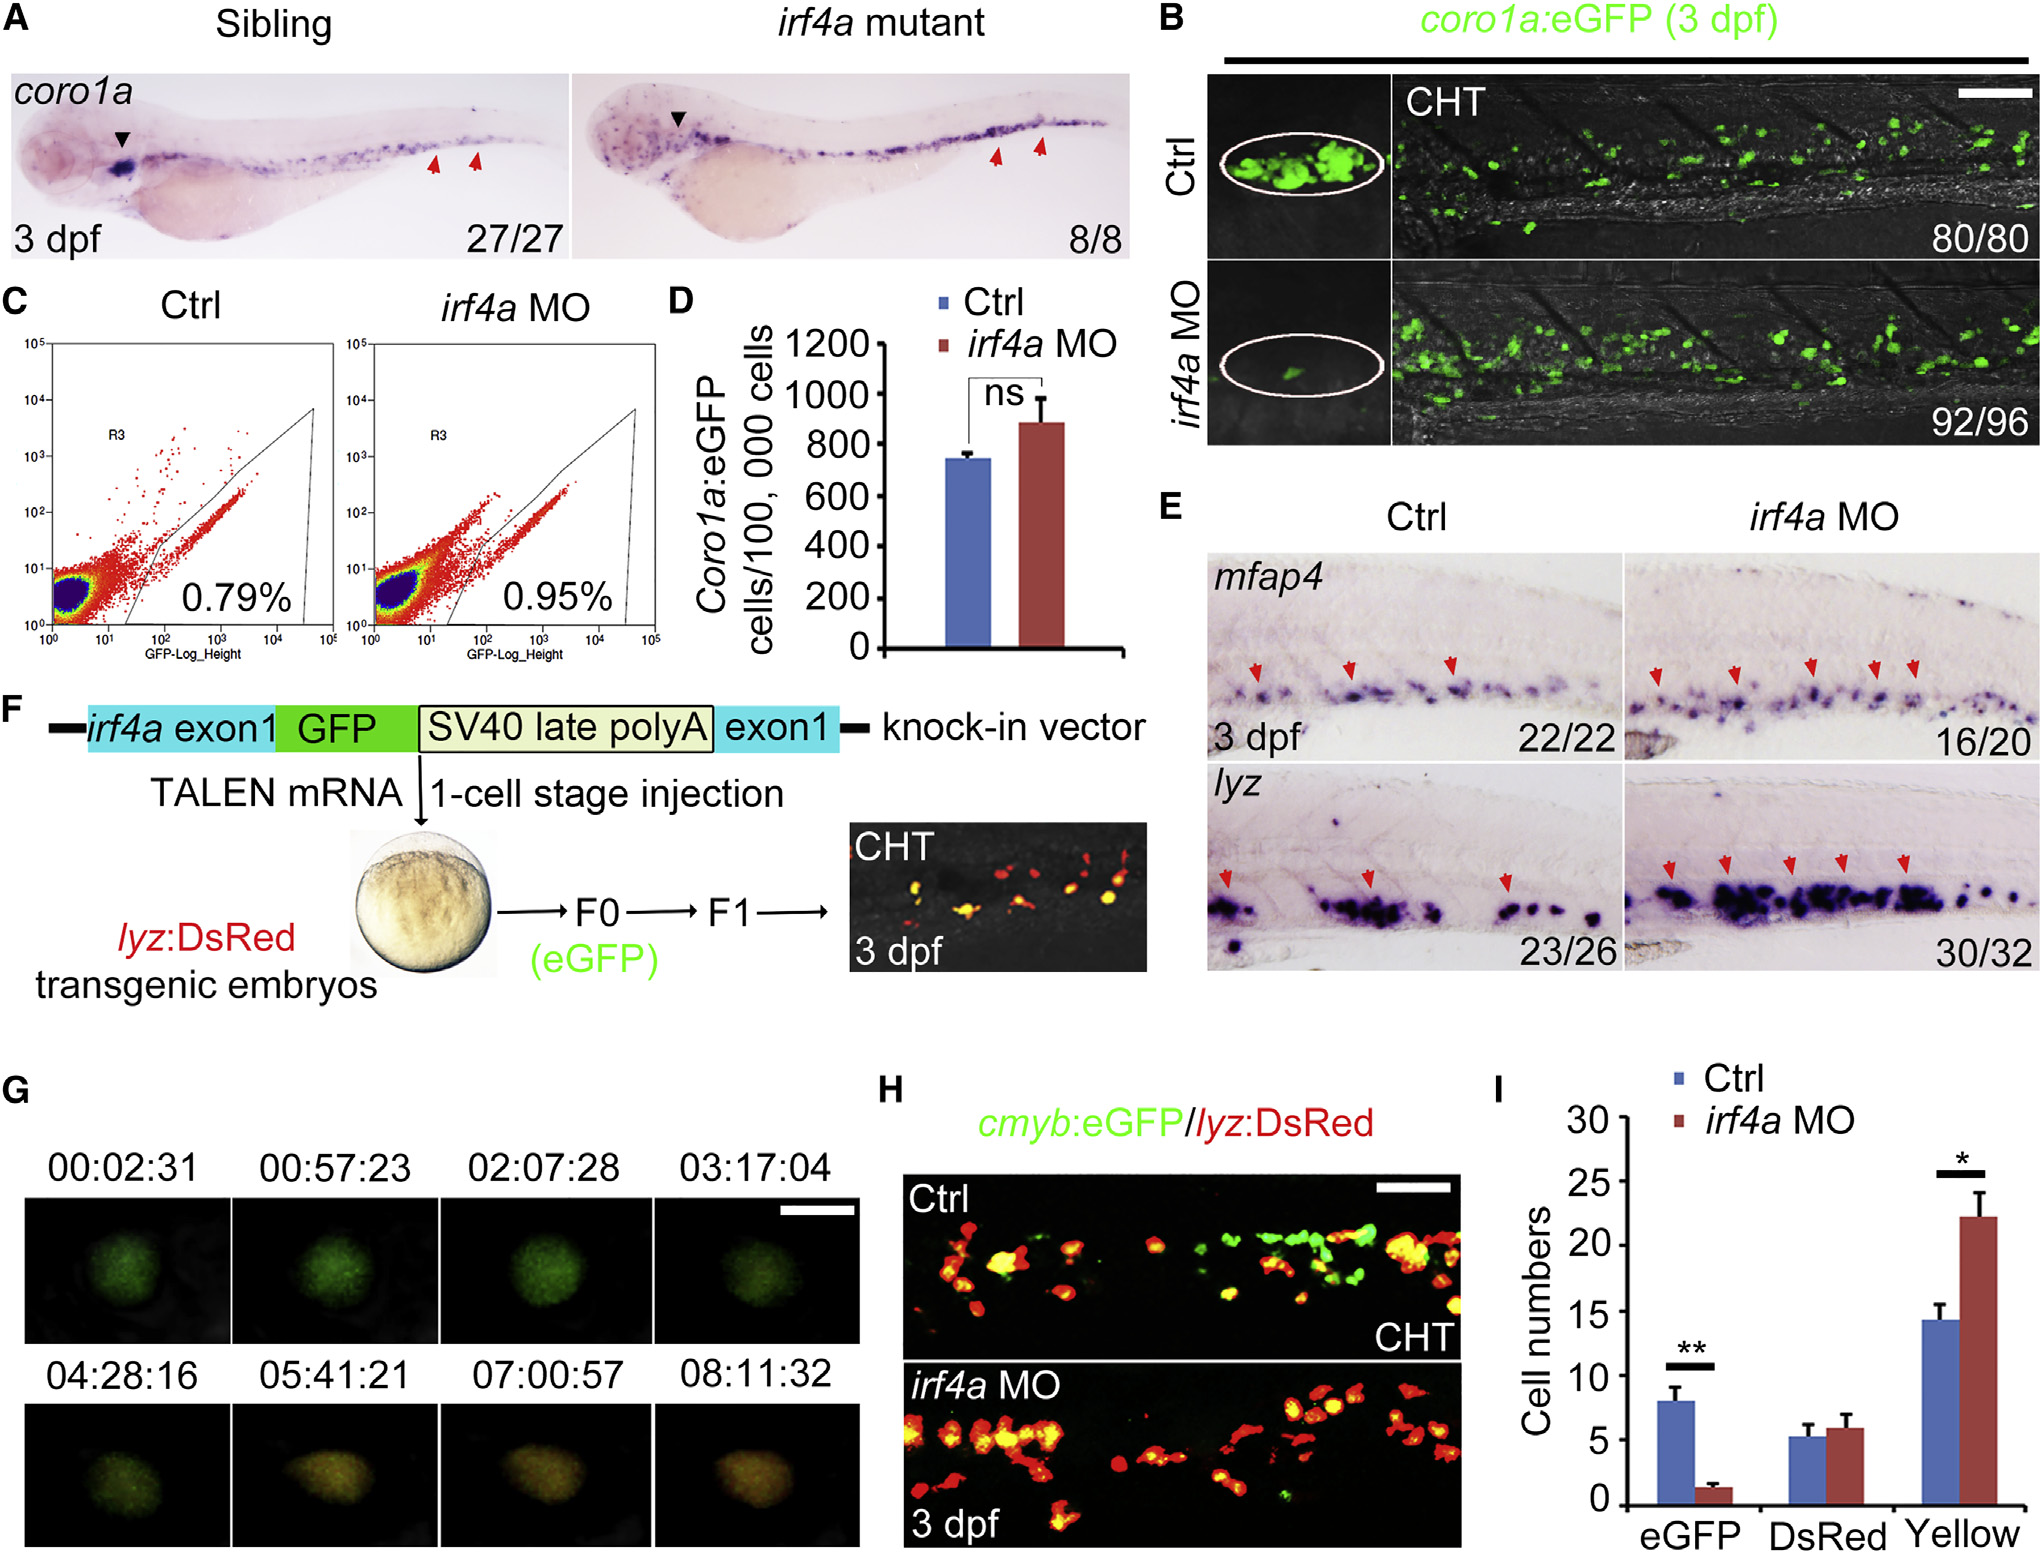
Irf4a-Deficient Lymphoid Progenitors Turn to Myeloid Cells
(A) Expression of coro1a in the siblings and irf4a mutants at 3 dpf. The black arrowhead indicates the thymus, and the red arrow indicates the coro1a-expressing cell in the CHT.
(B) Confocal images of coro1a:EGFP cells in the thymus (white circle) and CHT of the control and irf4a morphants at 3 dpf. Scale bar, 80 µm.
(C) Representative FACS analysis of whole-body coro1a:EGFP cells in the control and irf4a morphants at 3 dpf.
(D) Enumeration of whole-body coro1a:EGFP cells shown in (C). Data are representative of three independent experiments (n = 180). ns, not significant.
(E) Expression of mfap4 and lyz in the CHT of the control and irf4a morphants at 3 dpf. Red arrows indicate myeloid cells expressing mfap4 or lyz.
(F) Brief diagram of irf4a knockin construct and generation of transgenic line for single-cell tracing.
(G) Time-lapse imaging of the conversion of the irf4a-deficient cell with EGFP knockin to express lyz:DsRed in the CHT from 58 to 66 hpf. Scale bar, 10 µm.
(H) Confocal images of cmyb:EGFP/lyz:DsRed embryos showing cmyb:EGFP, lyz:DsRed, or yellow cells in the CHT of the control or irf4a morphants at 3 dpf. Scale bar, 40 µm.
(I) Enumeration of cmyb:EGFP, lyz:DsRed, or yellow cells shown in (H). p < 0.01; p < 0.05. All data are mean ± SD.
See also Figure S5 and Movie S2.
Reprinted from Developmental Cell, 34(6), Wang, S., He, Q., Ma, D., Xue, Y., Liu, F., Irf4 Regulates the Choice between T Lymphoid-Primed Progenitor and Myeloid Lineage Fates during Embryogenesis, 621-31, Copyright (2015) with permission from Elsevier. Full text @ Dev. Cell