
- Title
-
Neuregulin 1 Type II-ErbB Signaling Promotes Cell Divisions Generating Neurons from Neural Progenitor Cells in the Developing Zebrafish Brain
- Authors
- Sato, T., Sato, F., Kamezaki, A., Sakaguchi, K., Tanigome, R., Kawakami, K., Sehara-Fujisawa, A.
- Source
- Full text @ PLoS One
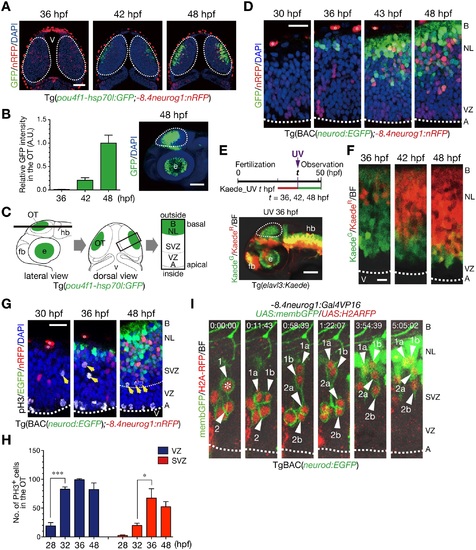
Generation of neurons is spatially and temporally regulated in the optic tectum of zebrafish embryos. A. Representative Tg(pou4f1-hsp70l:GFP;-8.4neurog1:nRFP) embryos in a dorsal view. GFP-positive neurons gradually expand from the outside (basal) to the inside (apical) region. The -8.4neurog1:nRFP is weakly expressed in a subset of NPCs, and highly expressed in pigment cells on the surface of the brain. Dotted circle, optic tectum (OT); v, ventricle. Scale bars, 50 µm. B. Quantification of pou4f1-hsp70l:GFP intensity in the OT (mean ± s.e.m.; n = 3, 5, 5 for 36, 42, 48 hpf, respectively). A.U., arbitrary units. Representative Tg(pou4f1-hsp70l:GFP) embryos at 48 hpf in a lateral view (right). Dotted circle, OT; e, eye. Scale bar, 100 µm. C. Schematics of confocal images from lateral (left) and dorsal (middle) views of the OT, and a image at a higher magnification from a dorsal view (right). Dotted circle, OT; fb, forebrain; hb, hindbrain; A, apical; B, basal; NL, neuronal layer; SVZ, sub-ventricular zone; VZ, ventricular zone. D. The OT of Tg(BAC(neurod:GFP);-8.4neurog1:nRFP) embryos in dorsal views. Dotted line, apical surface of the VZ; asterisk, pigment cell in the skin. Scale bar, 20 µm. E. (top) A timeline of experiments for UV irradiation. Embryos were subjected to UV irradiation at 36, 42 and 48 hpf. Neurons expressing Kaede were fluorescently labeled in red by the irradiation and neurons generated after the irradiation were labeled in green. (bottom) A lateral view of Tg(elavl3:Kaede) embryos irradiated with UV light at 36 hpf. Dotted circle, OT. Scale bar, 50 µm. F. Accumulation of older post-mitotic neurons (KaedeR) from the basal to apical regions of the OT in Tg(elavl3:Kaede). Dotted line, apical surface of the VZ. Scale bar, 10 µm. G. pH3-positive mitotic cells in the OT of Tg(BAC(neurod:GFP);-8.4neurog1:nRFP). Yellow arrows, pH3-positive cells in the sub-basal zone/SVZ. Thick dotted line, apical surface of the VZ; thin dotted line, approximate boundary between the VZ and the SVZ. H. Quantification of the number of pH3-positive cells in the VZ (blue) and the SVZ (red) of the developing OT (mean ± s.e.m.; *P < 0.05, ***P < 0.001; n = 3 per group). I. Time-lapse imaging of NPCs stochastically labeled by co-injection of -8.4neurog1:Gal4VP16/UAS:memb:GFP/UAS:H2ARFP plasmids into TgBAC(neurod:EGFP) embryos. Two NPCs (1, 2) underwent mitoses in the SVZ (asterisk) to produce two daughter cells (a, b) that ultimately differentiated into neurod:GFP-expressing post-mitotic neurons in the neuronal layer (NL; 1a, 1b, 2a). See also S1 Movie. |
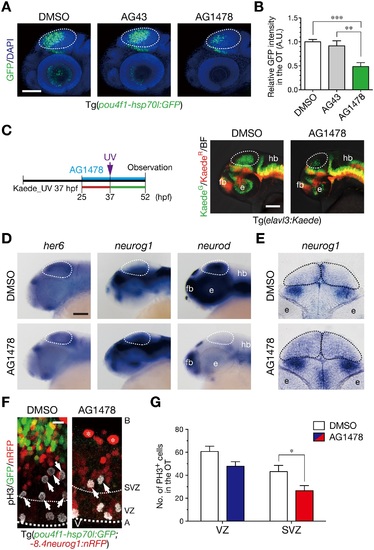
ErbB signaling is implicated in generation of neurons and mitoses in the sub-ventricular zone. A. Treatment with an ErbB inhibitor AG1478 prevents generation of GFP-expressing neurons in the OT of Tg(pou4f1-hsp70l:GFP) embryos, but not with the control AG43 and DMSO, at 52 hpf. Dotted circle, OT. Scale bar, 100 µm. B. Quantification of pou4f1-hsp70l:GFP intensity in the OT for the experiment shown in A (mean ± s.e.m.; **P < 0.01, ***P < 0.001; n = 8, 10, 16 for AG1478, AG43, DMSO, respectively). C. (left) A timeline of AG1478 treatment and irradiation of UV light on Tg(elavl3:Kaede). (right) Representative embryos showing impaired generation of neurons in the OT (dotted circle) at 52 hpf following AG1478 treatment. Scale bar, 50 µm. D. WISH of embryos at 44 hpf. Expression of neurog1 and neurod is increased and diminished, respectively, while expression of her6 is obviously unaltered in the OT following AG1478 treatment. Scale bar, 100 µm. E. A coronal section of WISH-stained embryos for neurog1 mRNA at 36 hpf. F. Impaired neurogenesis and a decrease in pH3-positive mitotic cells in the SVZ of AG1478-treated Tg(pou4f1-hsp70l:GFP;-8.4neurog1:nRFP) embryos (AG1478) compared to the control embryos (DMSO) at 40 hpf. Scale bar, 10 µm. G. Quantification of the number of pH3-positive cells in the OT for the experiment shown in F, in the VZ (blue) and the SVZ (red) of AG1478-treated embryos and the control (white) embryos (mean ± s.e.m.; *P < 0.05; n = 11, 7 for AG1478, DMSO, respectively). |
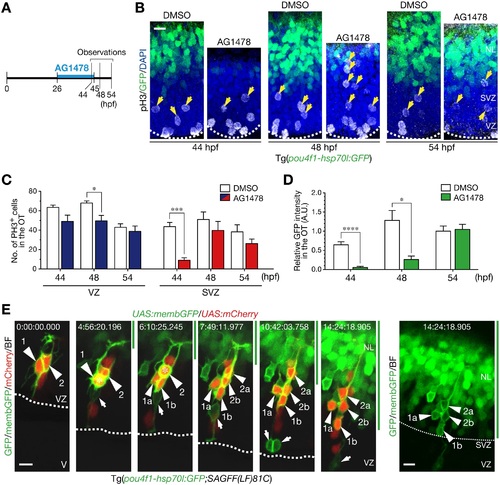
Mitoses generating neurons in the sub-ventricular zone require ErbB signaling. A. A timeline of experiments of AG1478 treatment. Embryos were soaked into 30 µM AG1478 solution or the control 2% DMSO from 26 to 45 hpf. Then, they were washed and grown in a fresh medium from 45 hpf. Embryos at 44, 48 and 54 hpf were collected for analyses. See also S3 Movie on the recovery of neurogenesis after removal of AG1478. B. pH3-positive mitotic cells in the OT. Removal of AG1478 at 45 hpf enhanced mitoses in the SVZ at 48 hpf prior to recovery of GFP-expressing neurons in the OT of Tg(pou4f1-hsp70l:GFP) at 54 hpf. Yellow arrows, pH3-positive cells in the SVZ. Scale bar, 10 µm. C. Quantification of the number of pH3-positive cells in the VZ (blue) and the SVZ (red) of AG1478-treated embryos and the control (white) embryos (mean ± s.e.m.; *P < 0.05, ***P < 0.001; n = 3, 5, 5 for AG1478, n = 6, 4, 6 for DMSO at 44, 48, 54 hpf, respectively). D. Quantification of GFP intensity in the OT (mean ± s.e.m.; *P < 0.05, ****P < 0.0001; n = 6, 4, 5 for AG1478, n = 6, 4, 6 for DMSO at 44, 48, 54 hpf, respectively). E. Time-lapse imaging of NPCs stochastically labeled by co-injection of UAS:mCherry/UAS:memb:GFP plasmids into Tg(pou4f1-hsp70l:GFP;SAGFF(LF)81C) embryos. After the removal of AG1478, two NPCs (1, 2; arrowheads) divided once in the SVZ (asterisk) to generate two daughter cells (a, b), and then, these cells were incorporated into the presumptive neuronal layer (NL, green bar, above the thin dotted line). Note that mitoses of these NPCs were not preceded by mitoses in the apical VZ and those NPCs began to express cytoplasmic GFP (right). An apical mitosis of another NPC or RGC labeled with membGFP was also observed in this imaging (arrow). Scale bar, 10 µm. See also S5 Movies. |
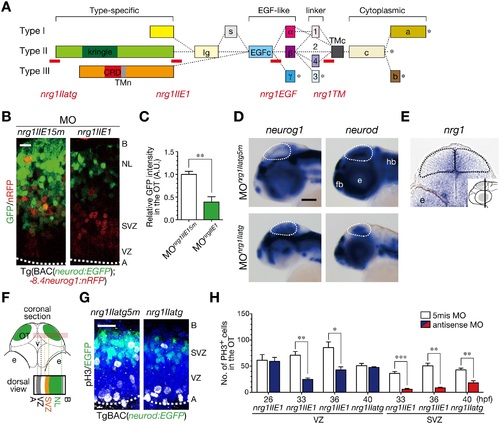
Generation of post-mitotic neurons requires NRG1-II. A. MOs against nrg1 used in this study. Domain structures of NRG1 type I–III isoforms are shown together with the target site (red bar) of each nrg1 MO. B. Decreased neurod:EGFP-positive neurons in MOnrg1IIE1-injected embryos (nrg1IIE1) compared to the control 5 nucleotides-mismatched MOnrg1IIE15m-injected embryos (nrg1IIE15m) of Tg(BAC(neurod:GFP);-8.4neurog1:nRFP) at 50 hpf. Scale bar, 10 µm. C. Quantification of neurod:EGFP intensity in the OT for the experiment shown in A (mean ± s.e.m.; **P < 0.01; n = 4 per group). D. WISH of MOnrg1IIatg-injected and the control MOnrg1IIatg5m-injected embryos for neurog1 and neurod mRNAs at 48 hpf. Scale bar, 100 µm. E. A coronal section of WISH-stained embryos for nrg1 mRNA at 36 hpf. The approximate site of the section is shown in a lateral view in the inset. F. A schematic of a stacked image of confocal sections from a dorsal view and the higher magnification of the OT from a dorsal view (bottom). G. Impaired neurogenesis and a decrease in pH3-positive mitotic cells in the SVZ of MOnrg1IIatg-injected TgBAC(neurod:EGFP) embryos (nrg1IIatg) compared to the control embryos (nrg1IIatg5m) at 40 hpf. Scale bar, 20 µm. H. Quantification of the number of pH3-positive cells in the VZ (blue) and the SVZ (red) of MOnrg1II-injected embryos and the control (white) embryos (mean ± s.e.m.; *P < 0.05, **P < 0.01, ***P < 0.001; n = 6, 6, 4, for nrg1IIE1, n = 6, 5, 5 for nrg1IIE15m at 26, 33, 36 hpf, n = 3, 4 for nrg1IIatg, nrg1IIatg5m at 40 hpf, respectively). |
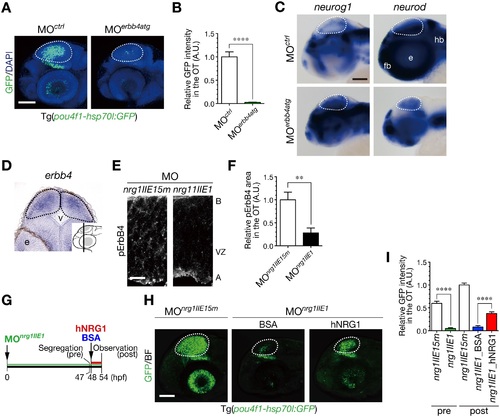
NRG1-II stimulates neurogenesis through ErbB4 as a cell-extrinsic signal. A. Impaired neurogenesis in MOerbb4atg-injected Tg(pou4f1-hsp70l:GFP) embryos at 50 hpf. Dotted circle, OT. Scale bar, 100 µm. B. Quantification of pou4f1-hsp70l:GFP intensity in the OT for the experiment shown in A (mean ± s.e.m.; ****P < 0.0001). C. WISH of MOerbb4atg-injected and the control MOctrl-injected embryos for neurog1 and neurod mRNAs at 48 hpf. Scale bar, 100 µm. D. A coronal section of WISH-stained embryos for erbb4 mRNA at 36 hpf. The approximate site of the section is shown in a lateral view in the inset. E. A decrease in Tyr1162-phosphorylated ErbB4 (pErbB4) in the OT of MOnrg1IIE1-injected embryos (nrg1IIE1) compared to the control MOnrg1IIE15m-injected embryos (nrg1IIE15m) at 40 hpf. Scale bar, 10 µm. F. Quantification of pErbB4-positive area in the OT for the experiment shown in E (mean ± s.e.m; **P < 0.01; n = 8, 9 for MOnrg1IIE1, MOnrg1IIE15m, respectively). G. A timeline of the injection of hNRG1 proteins into the hindbrain ventricle. MOnrg1IIE1-injected embryos with neurogenic phenotypes were segregated at 47 hpf, and they were subjected to intra-ventricle injection of hNRG1 or the control BSA. These embryos were analyzed at 54 hpf. H. Partial rescue of the defective neurogenesis in MOnrg1IIE1-injected Tg(pou4f1-hsp70l:GFP) embryos at 54 hpf following the injection of hNRG1 proteins, compared to the control BSA injection. Scale bar, 100 µm. I. Quantification of pou4f1-hsp70l:GFP intensity in the OT for the experiment shown in H (mean ± s.e.m.; ****P < 0.0001; n = 17 for MOnrg1IIE1_pre, n = 21 for MOnrg1IIE15m_pre, n = 11 for MOnrg1IIE1_BSA, n = 16 for MOnrg1IIE1_hNRG1, n = 18 for MOnrg1IIE15m_post.). |
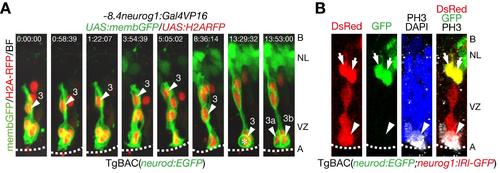
Mitoses of neural progenitor cells in the apical ventricular zone generate clonaly aligned neural progenitor cells. A. Time-lapse imaging of neural progenitor cells (NPCs) in the optic tectum stochastically labeled by co-injection of -8.4neurog1:Gal4VP16/UAS:memb:GFP/UAS:H2ARFP plasmids into TgBAC(neurod:EGFP) embryos. NPC (3) underwent interkinetic nuclear migration prior to mitosis (asterisk) in the apical VZ. See also S2 Movie. A, apical; B, basal; NL, neuronal layer; VZ, ventricular zone. B. A single cell lineage of a TgBAC(neurod:EGFP;neurog1:lRl(loxP-DsRed-loxP)-GFP) embryo including both neurod:EGFP-positive neurons (arrows) and a dividing neurog1:DsRed-positive NPC (arrow head). TgBAC(neurog1:lRl-GFP) expresses DsRed in the absence of Cre. |
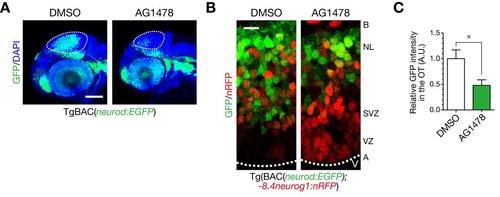
Generation of post-mitotic neurons is impaired in the optic tectum by treatment with an ErbB inhibitor AG1478. A. Impaired generation of post-mitotic neurons in the optic tectum (OT; dotted circle) at 48 hpf following AG1478 treatment in TgBAC(neurod:EGFP) embryos, shown in a lateral view. Scale bar, 100 µm. B. Decreased neurod:EGFP-positive post-mitotic neurons and accumulated -8.4neurog1:nRFP-positive NPCs at 48 hpf by AG1478 treatment. A, apical; B, basal; NL, neuronal layer; SVZ, sub-ventriular zone; VZ, ventricular zone. Scale bar, 10 µm. C. Quantification of neurod:EGFP intensity in the OT for the experiment shown in A (mean ± s.e.m.; *P < 0.05, unpaired t test; n = 4–5). |
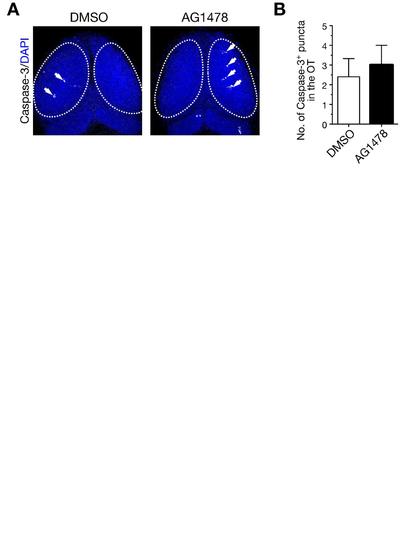
Treatment with AG1478 does not induce apoptosis in the optic tectum. A. Immunohistochemical staining of embryos treated with AG1478 and the control DMSO with anti-activated Caspase-3 antibody at 38 hpf. Arrow, Caspase-3-positive puncta; dotted circle, optic tectum (OT). B. Quantification of the number of Caspase-3-positive puncta in the OT for the experiment shown in A (mean ± s.e.m.; DMSO, 2.4 ± 0.93, n = 5, AG1478, 3.0 ± 1.00, n = 5, p = 0.67, unpaired t test). |
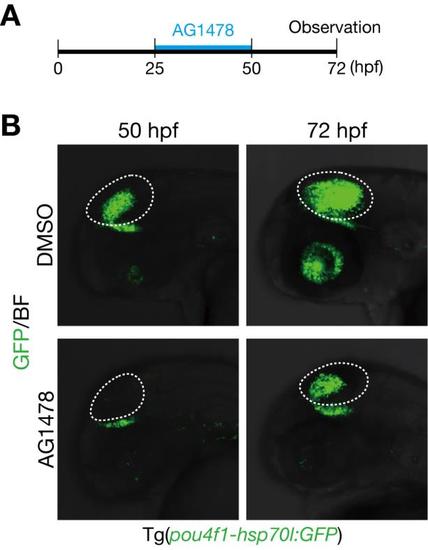
Generation of GFP-expressing neurons in the optic tectum is partially recovered after removal of AG1478. A. A timeline of experiments of AG1478 treatment. Embryos were soaked into 25 µM AG1478 solution or the control DMSO from 25 to 50 hpf. Then, they were washed and grown in a fresh medium. Embryos at 72 hpf were collected for analyses. B. Decreased pou4f1-hsp70l:GFP-positive neurons in the optic tectum of AG1478-treated embryos at 50 hpf were partially recovered at 72 hpf compared to the control DMSO in Tg(pou4f1-hsp70l:GFP). |
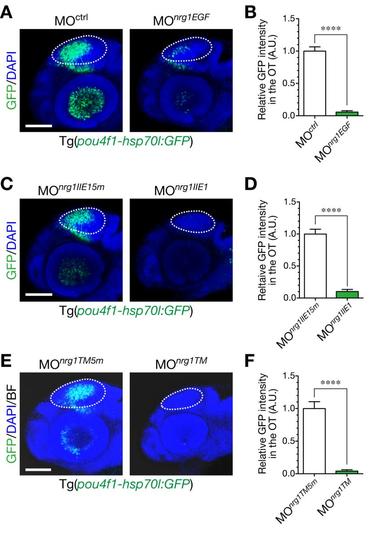
Defective generation of GFP-expressing neurons in the optic tectum by injection of antisense MOs against nrg1. A. Knockdown of all isoforms of NRG1 by injection of MOnrg1EGF. Representative embryos injected with MOnrg1EGF (right) or the control MOctrl (left) shown in a lateral view at 48 hpf. Dotted circle, optic tectum (OT). Scale bar, 100 µm. B. Quantification of pou4fl-hsp70l:GFP intensity in the OT for the experiment shown in A (mean ± s.e.m.; ****P < 0.0001, unpaired t test; n = 6–7). C. Impaired neurogenesis in a representative MOnrg1IIE1-injected Tg(pou4f1-hsp70l:GFP) embryo (right) compared to the control MOnrg1IIE15m (5 nucleotides-mismatched control)-injected embryo (left) at 50 hpf. Scale bar, 100 µm. D. Quantification of pou4f1-hsp70l:GFP intensity in the OT for the experiment shown in C (mean ± s.e.m.; ****P < 0.0001; n = 8 per group). E. Knockdown of membrane-bound isoforms of NRG1 by injection of MOnrg1TM. Representative embryos injected with MOnrg1TM (right) or the control, MOnrg1TM5m (left) shown in a lateral view at 53 hpf. Dotted circle, OT. Scale bar, 100 µm. F. Quantification of pou4f1-hsp70l:GFP intensity in the OT for the experiment shown in E (mean ± s.e.m.; ****P < 0.0001, unpaired t test; n = 6 per group). |
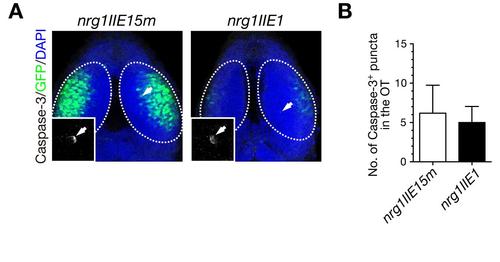
Injection of MOnrg1IIE1 does not induce apoptosis in the optic tectum. A. Immunohistochemical staining of embryos injected with MOnrg1IIE1 and the control MOnrg1IIE15m with anti-activated Caspase-3 antibody at 50 hpf. Higher magnification of the Caspase-3-positive punctum is shown in the inset. Arrow, Caspase-3-positive puncta; dotted circle, optic tectum (OT). B. Quantification of the number of Caspase-3-positive puncta in the OT for the experiment shown in A (mean ± s.e.m.; nrg1IIE15m, 6.2 ± 3.54, n = 5, nrg1IIE1, 5.0 ± 2.05, n = 5, p = 0.78, unpaired t test). |
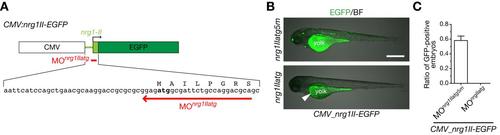
MOnrg1IIatg specifically suppresses ectopic expression of NRG1-II. A. A schematic structure of an expression plasmid CMV:nrg1II-EGFP (top), a part of the nucleotide and amino acid sequences encoding 5′ untranslated and coding regions in the first exon of nrg1-II (middle), and the target sequence of MOnrg1IIatg (bottom, red arrow). B. Representative 74-hpf embryos co-injected with CMV:nrg1II-EGFP expression plasmid and MOnrg1IIatg or the control MOnrg1IIatg5m shown in a lateral view. Green fluorescence in yolk of MOnrg1IIatg-injected embryos is autoflurescence (arrowhead). Scale bar, 500 µm. C. Quantification of ratios of GFP-positive embryos co-injected with CMV:nrg1II-EGFP and MOnrg1IIatg or the control MOnrg1IIatg5m at 25 hpf. No GFP-positive embryos were detected for MOnrg1IIatg-injected embryos under a fluorescent dissection microscopy. (mean ± s.e.m.; nrg1IIatg5m, 0.56 ± 0.08, n = 183 embryos by 4 injections, nrg1IIatg, 0.00 ± 0.00, n = 98 embryos by 4 injections). |
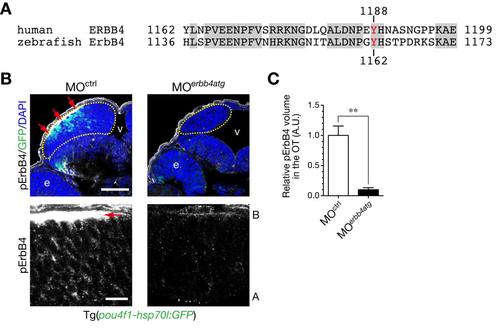
Immunostained signals for Tyr1162-phosphorylated ErbB4 are diminished in the optic tectum by injection of MOerbb4atg. A. Alignment of amino acid sequences of human ERBB4 and zebrafish ErbB4 around Tyr1188 of human ERBB4. Identical amino acids are indicated by shaded boxes. A tyrosine residue recognized by the anti-phospho-HER4 pTyr1188 (pErbB4) antibody is shown in red. B. Immunohistochemical staining of cryosections of Tg(pou4f1-hsp70l:GFP) embryos at 48 hpf with the anti-pErbB4 antibody. Embryos were injected with MOerbb4atg (right) or with standard control MOctrl (left). Yellow dotted circle, optic tectum (OT); e, eye; v, ventricle. Images at higher magnification in the OT are shown below. The strong signals for pErbB4 in the basal region (red arrows) would be probably derived from ErbB4 localized in dendrites of neurons, because the signals are disappeared in embryos injected with MOerbb4atg. A, apical; B, basal. Scale bars, 50 µm (top), 10µm (bottom). C. Quantification of volume of pErbB4 puncta in the OT for the experiment shown in B (mean ± s.e.m.; **P < 0.01, unpaired t test; n = 7–8). The strong signals in the basal region (B, red arrows) are not included in this analysis. |