
|
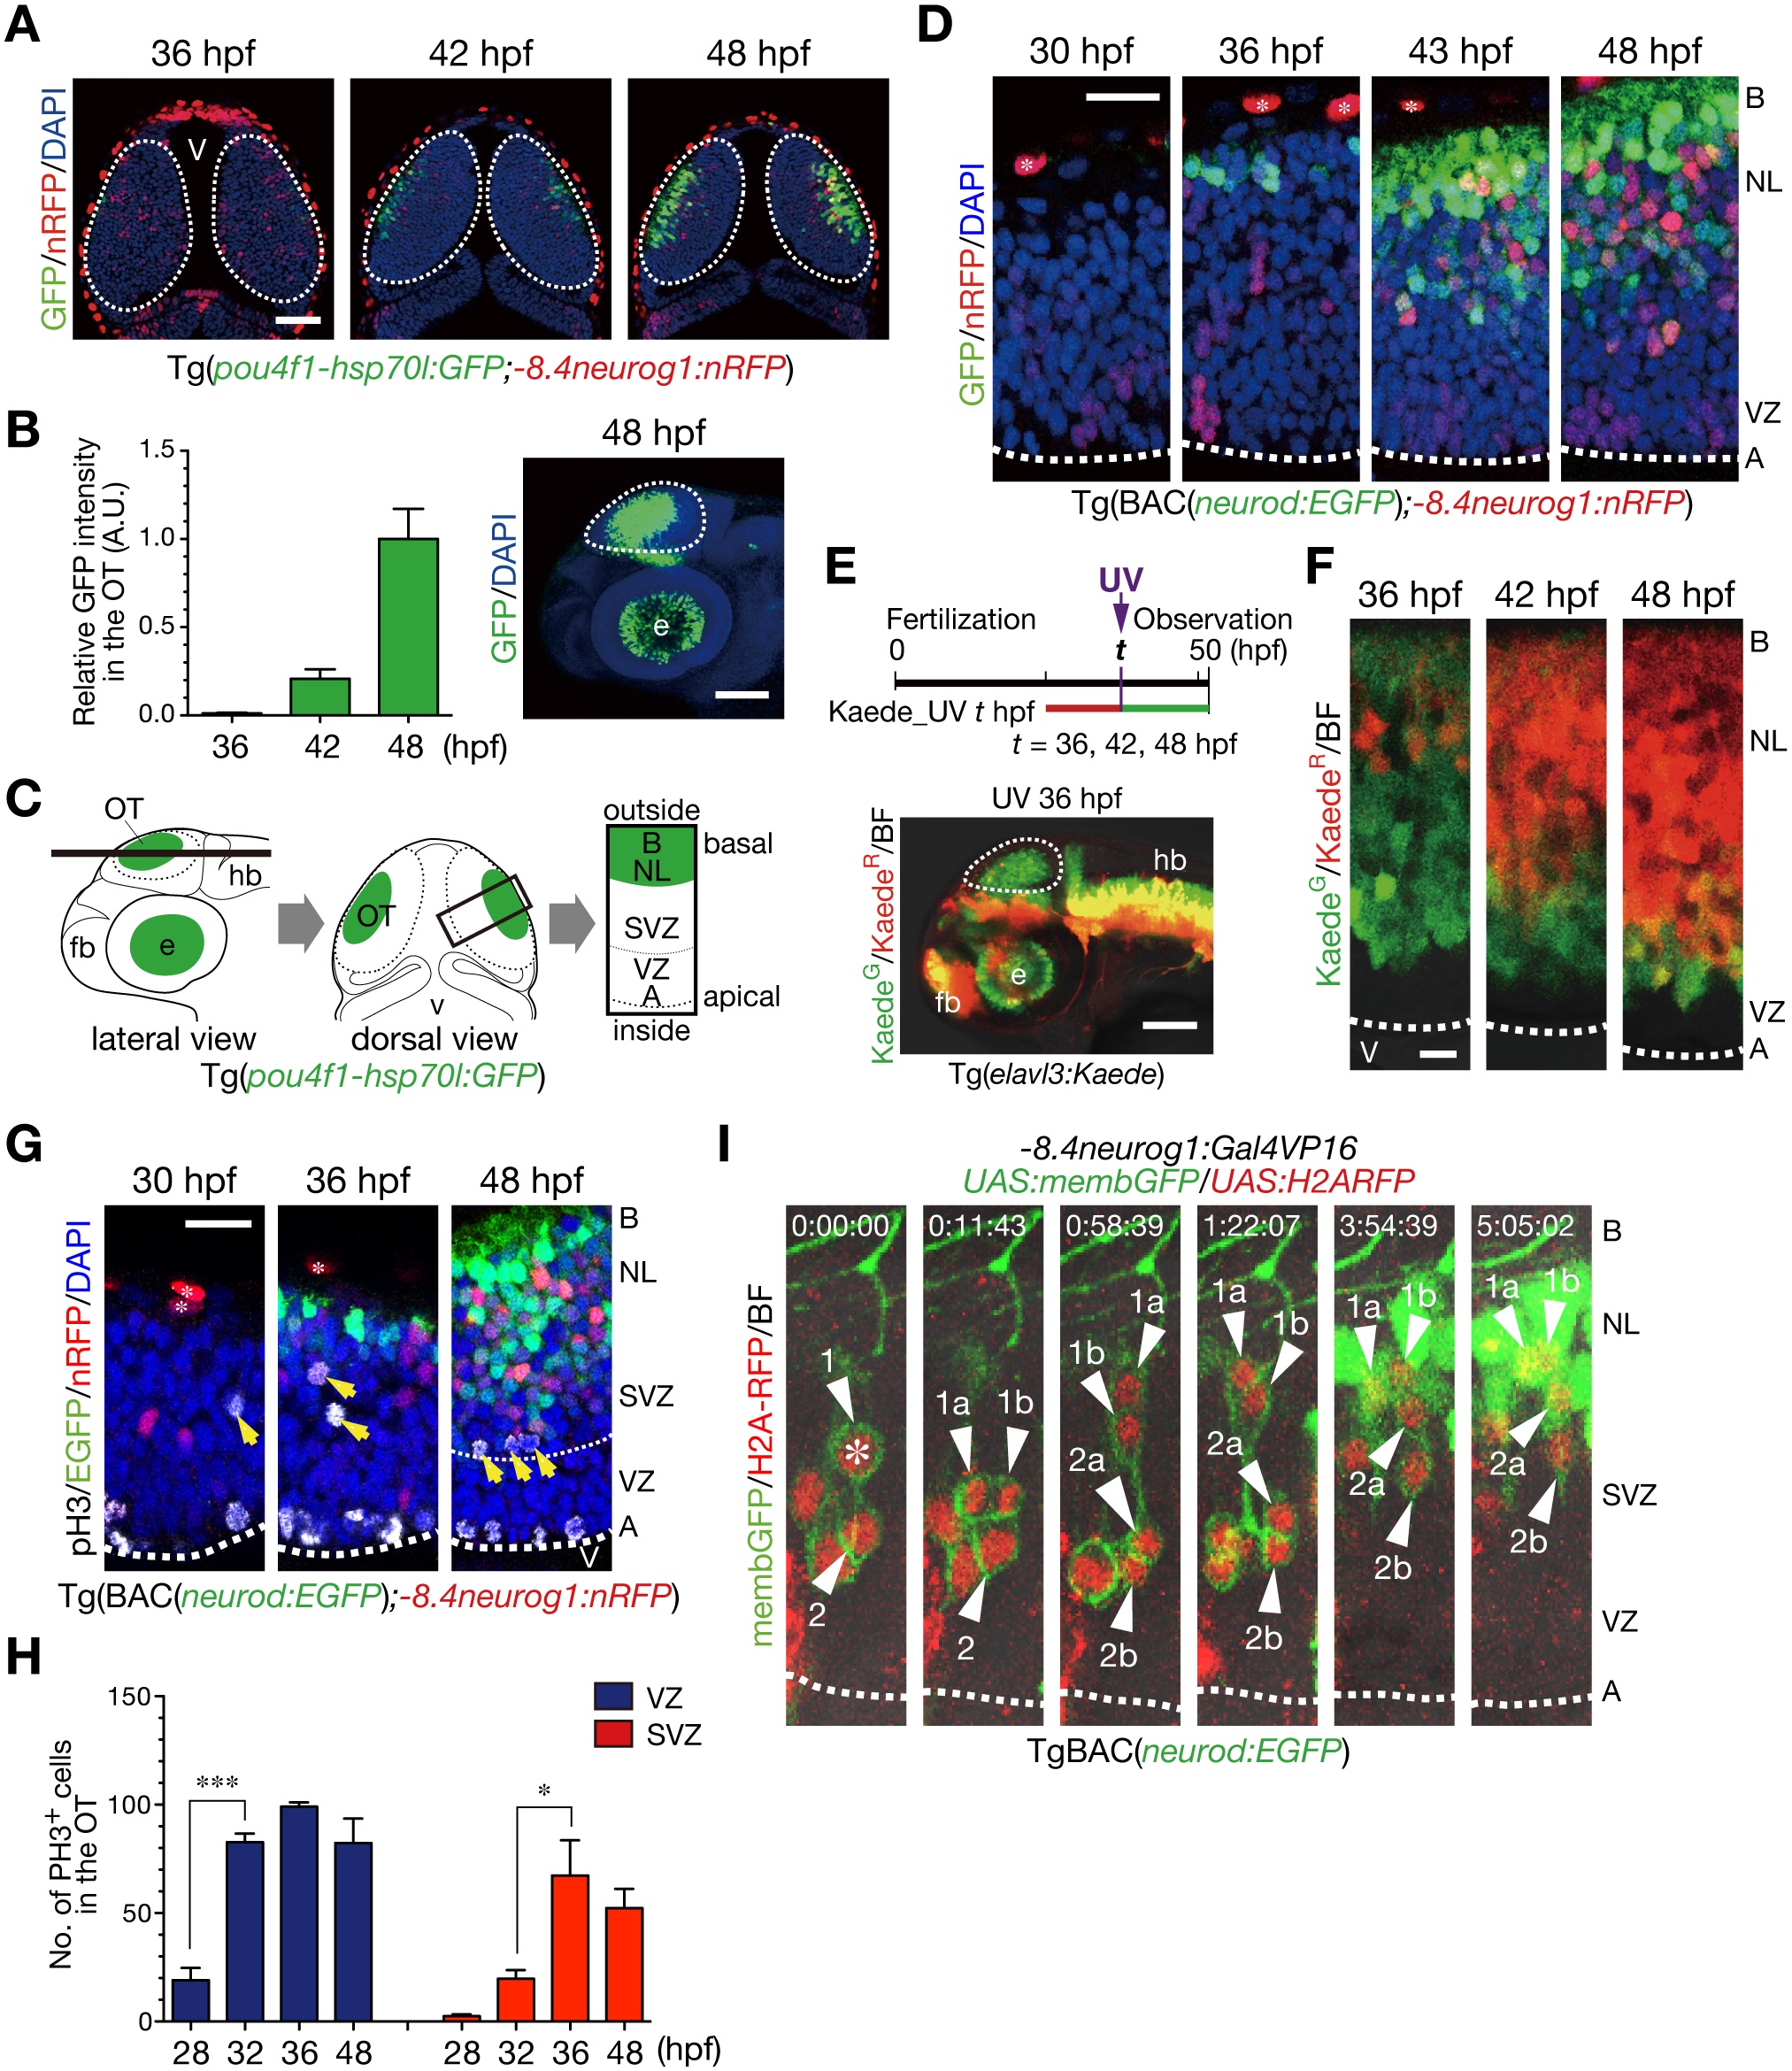
Fig. 1 Generation of neurons is spatially and temporally regulated in the optic tectum of zebrafish embryos.
A. Representative Tg(pou4f1-hsp70l:GFP;-8.4neurog1:nRFP) embryos in a dorsal view. GFP-positive neurons gradually expand from the outside (basal) to the inside (apical) region. The -8.4neurog1:nRFP is weakly expressed in a subset of NPCs, and highly expressed in pigment cells on the surface of the brain. Dotted circle, optic tectum (OT); v, ventricle. Scale bars, 50 µm. B. Quantification of pou4f1-hsp70l:GFP intensity in the OT (mean ± s.e.m.; n = 3, 5, 5 for 36, 42, 48 hpf, respectively). A.U., arbitrary units. Representative Tg(pou4f1-hsp70l:GFP) embryos at 48 hpf in a lateral view (right). Dotted circle, OT; e, eye. Scale bar, 100 µm. C. Schematics of confocal images from lateral (left) and dorsal (middle) views of the OT, and a image at a higher magnification from a dorsal view (right). Dotted circle, OT; fb, forebrain; hb, hindbrain; A, apical; B, basal; NL, neuronal layer; SVZ, sub-ventricular zone; VZ, ventricular zone. D. The OT of Tg(BAC(neurod:GFP);-8.4neurog1:nRFP) embryos in dorsal views. Dotted line, apical surface of the VZ; asterisk, pigment cell in the skin. Scale bar, 20 µm. E. (top) A timeline of experiments for UV irradiation. Embryos were subjected to UV irradiation at 36, 42 and 48 hpf. Neurons expressing Kaede were fluorescently labeled in red by the irradiation and neurons generated after the irradiation were labeled in green. (bottom) A lateral view of Tg(elavl3:Kaede) embryos irradiated with UV light at 36 hpf. Dotted circle, OT. Scale bar, 50 µm. F. Accumulation of older post-mitotic neurons (KaedeR) from the basal to apical regions of the OT in Tg(elavl3:Kaede). Dotted line, apical surface of the VZ. Scale bar, 10 µm. G. pH3-positive mitotic cells in the OT of Tg(BAC(neurod:GFP);-8.4neurog1:nRFP). Yellow arrows, pH3-positive cells in the sub-basal zone/SVZ. Thick dotted line, apical surface of the VZ; thin dotted line, approximate boundary between the VZ and the SVZ. H. Quantification of the number of pH3-positive cells in the VZ (blue) and the SVZ (red) of the developing OT (mean ± s.e.m.; *P < 0.05, ***P < 0.001; n = 3 per group). I. Time-lapse imaging of NPCs stochastically labeled by co-injection of -8.4neurog1:Gal4VP16/UAS:memb:GFP/UAS:H2ARFP plasmids into TgBAC(neurod:EGFP) embryos. Two NPCs (1, 2) underwent mitoses in the SVZ (asterisk) to produce two daughter cells (a, b) that ultimately differentiated into neurod:GFP-expressing post-mitotic neurons in the neuronal layer (NL; 1a, 1b, 2a). See also S1 Movie.