
- Title
-
Involvement of Delta/Notch signaling in zebrafish adult pigment stripe patterning
- Authors
- Hamada, H., Watanabe, M., Lau, H.E., Nishida, T., Hasegawa, T., Parichy, D.M., and Kondo, S.
- Source
- Full text @ Development
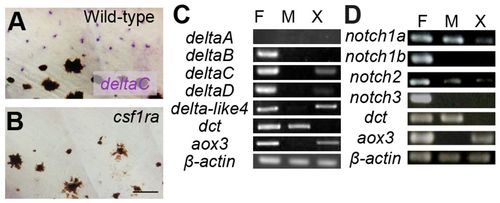
Expression analysis of Notch receptors and their ligands. (A,B) In situ hybridization for deltaC in larval fish. Presumptive xanthophores in the inter stripe are stained in wild type (A) but these cells and deltaC staining is absent in the csf1ra mutant (B). (C,D) Expression by RT-PCR of major Notch ligands (C) and Notch receptors (D). F, fins; M, melanophores; X, xanthophores. dct and aox3 are markers for melanophores and xanthophores, respectively. Scale bar: 50 μm. EXPRESSION / LABELING:
PHENOTYPE:
|
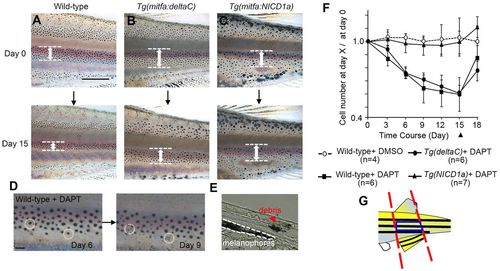
Effect of Notch inhibitor on melanophores. (A-C) Altered melanophore distributions resulting from DAPT treatment over 15 days. Width of black stripes (white arrows) became narrowed in wild-type and Tg(mitfa:deltaC) fish, but remained unchanged in Tg(mitfa:NICD1a) fish. (D) Death of melanophores. Two cells (circled by dotted lines) present at day 6 (left) were lost by day 9 (right), though residual melanin-containing debris remains visible. (E) Cross-section through the skin of a DAPT-treated fish. A remaining melanophore is in the lowest layer of the skin (bounded by white dashed line). Melanin-containing debris from a dead cell was observed (red arrowhead) more superficially in the dermis. (F) Alteration of melanophore numbers (mean ± s.d.) during DAPT treatment, shown as the ratio of cells surviving at day X relative to the total number of cells at day 0. DAPT was applied at day 0 and removed at day 15 (black arrowhead). (G) Blue box shows the region in which melanophores were counted for analyses shown in F, defined as the middle stripe, delimited by anterior and posterior margins of the caudal and dorsal fins. Scale bars: 1 mm (A-C); 100 μm (D). PHENOTYPE:
|
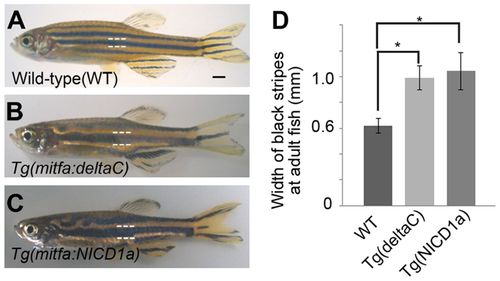
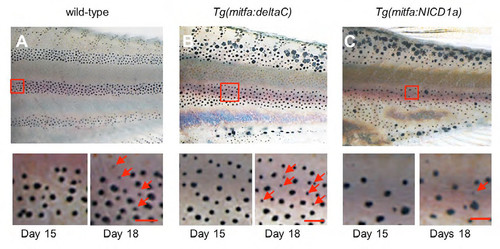
Ectopic expression of DeltaC and Notch-NICD alter stripes. (A-C) Expression of DeltaC (B) and the Notch1a intracellular domain (C) in melanophores resulted in fewer, wider stripes than those in wild type (A). (D) Width of black stripes in transgenic fish [wild type, n=12; Tg(mitfa:deltaC), n=12; Tg(mitfa:NICD1a), n=13]. *P<0.0001 (Student’s t-test). Error bars represent s.d. Scale bar: 1 mm. PHENOTYPE:
|
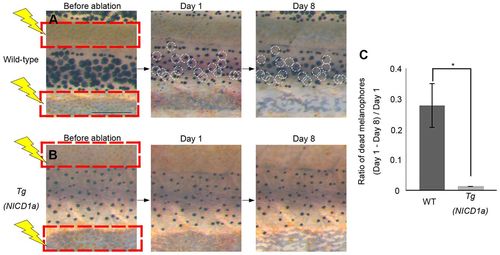
Melanophore survival is independent of xanthophores in Tg(mitfa:NICD1a) transgenic fish. (A,B) Effects on melanophores after ablation of xanthophores is shown for wild type (A) and Tg(mitfa:NICD1a) (B). Red squares indicate the areas in which xanthophores were ablated. White circles indicate melanophores present on day 1 but lost by day 8. (C) Proportion of melanophores that died in wild-type and Tg(mitfa:NICD1a) fish (n=5, respectively). *P<0.0001 (Student’s t-test). Error bars represent s.d. Scale bar: 500 μm. |
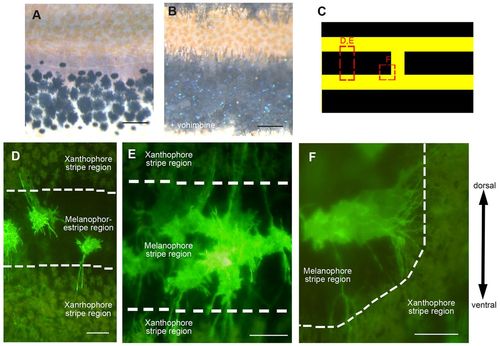
Melanophores extend long projections. (A,B) Black stripe region of wild-type fish in the normal condition (A) and after addition of yohimbine (B), which reveals projections extending towards xanthophores. (C) Regions imaged in D-F. (D-F) Fluorescent images of melanophore membranes revealed by mitfa: EGFP-CAAX expression in brassb2 mutants. (D) Three melanophores in the black stripe extend long projections towards xanthophores. (E) A cluster of melanophores, each of which exhibits long projections. (F) Melanophores adjacent to a break in the stripe extend long projections radially. Scale bars: 100 μm. |
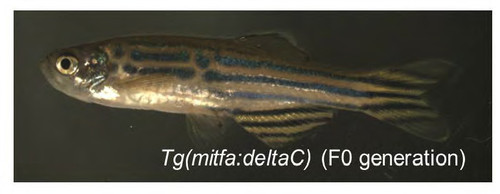
Pattern change observed during primary screening of candidate genes. 2/15 F0 fish mosaic for the mitfa:deltaC transgene showed abnormal pigment patterns. No transgenic fish for other candidate gene exhibited such stripe abnormalities. Presence of the transgene was confirmed by genomic PCR. |
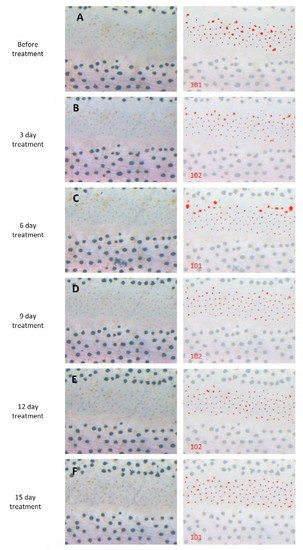
Xanthophores were not affected by DAPT treatment. (A-F) Left panels are original images. In right panels, xanthophores we counted are marked by red overlay. The number of xanthophores is shown at the bottom-left of each panel. Scale bar: 500 μm. |
Recovery of melanophores after the removal of DAPT. (A-C) After 15 day DAPT treatment, fish were moved to normal water. To assess the recovery, melanophore distributions were compared between day 15 and day 18. Red arrows show newly differentiated melanophores. In wild-type and Tg(mitfa:deltaC) transgenic fish, new melanophores developed rapidly, whereas no changes were observed for Tg(mitfa:NICD1a) transgenic fish. Scale bars: 100μm. |

Projections in melanophores in csf1ra mutant and xanthophores in wild-type. (A) Long projections of melanophores were rarely observed in csf1ra mutant, which lacks xanthophores. (B, C) As there is a leak expression of Mitfa promoter in F0 fish, xanthophore membrane is also visible with the same construct. Most of xanthophores do not have long projections in wild type fish(B). We rarely found xanthophores with long projection(C). (D) Design of plasmid for the EGFP-CAAX. Upper line indicated the plasmid which used in (Watanabe and Kondo, 2012). Lower line indicated the plasmid which used in this study. |
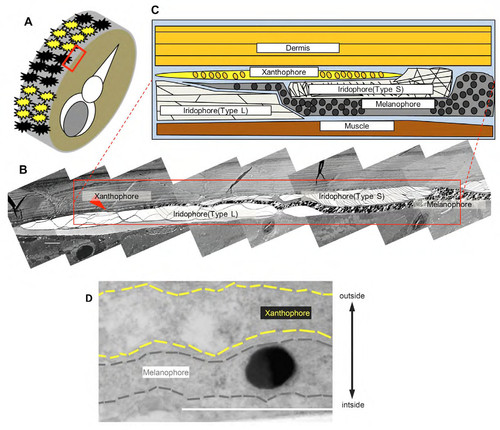
Electron microscopy of zebrafish skin showing the direct contact between melanophores and xanthophores. (A) Region of the skin examined by transmission electron microscopy (red square). (B) Low magnification image showing different pigment cell classes. (C) Schematic rendering of boxed region in (B). (D) Magnified image of melanophore projection tip in other sample. In the previous report of electron microscopy analysis, we showed that melanophores and xanthophores are generally separated by the insertion of iridophores (Hirata et al., 2003). We found, however, that melanophore membrane (black dashed line) and xanthophore membrane (yellow dashed line) were close proximity to one another at the stripe boundary. Scale bar = 5μm in B, 1μm in D. |