
|
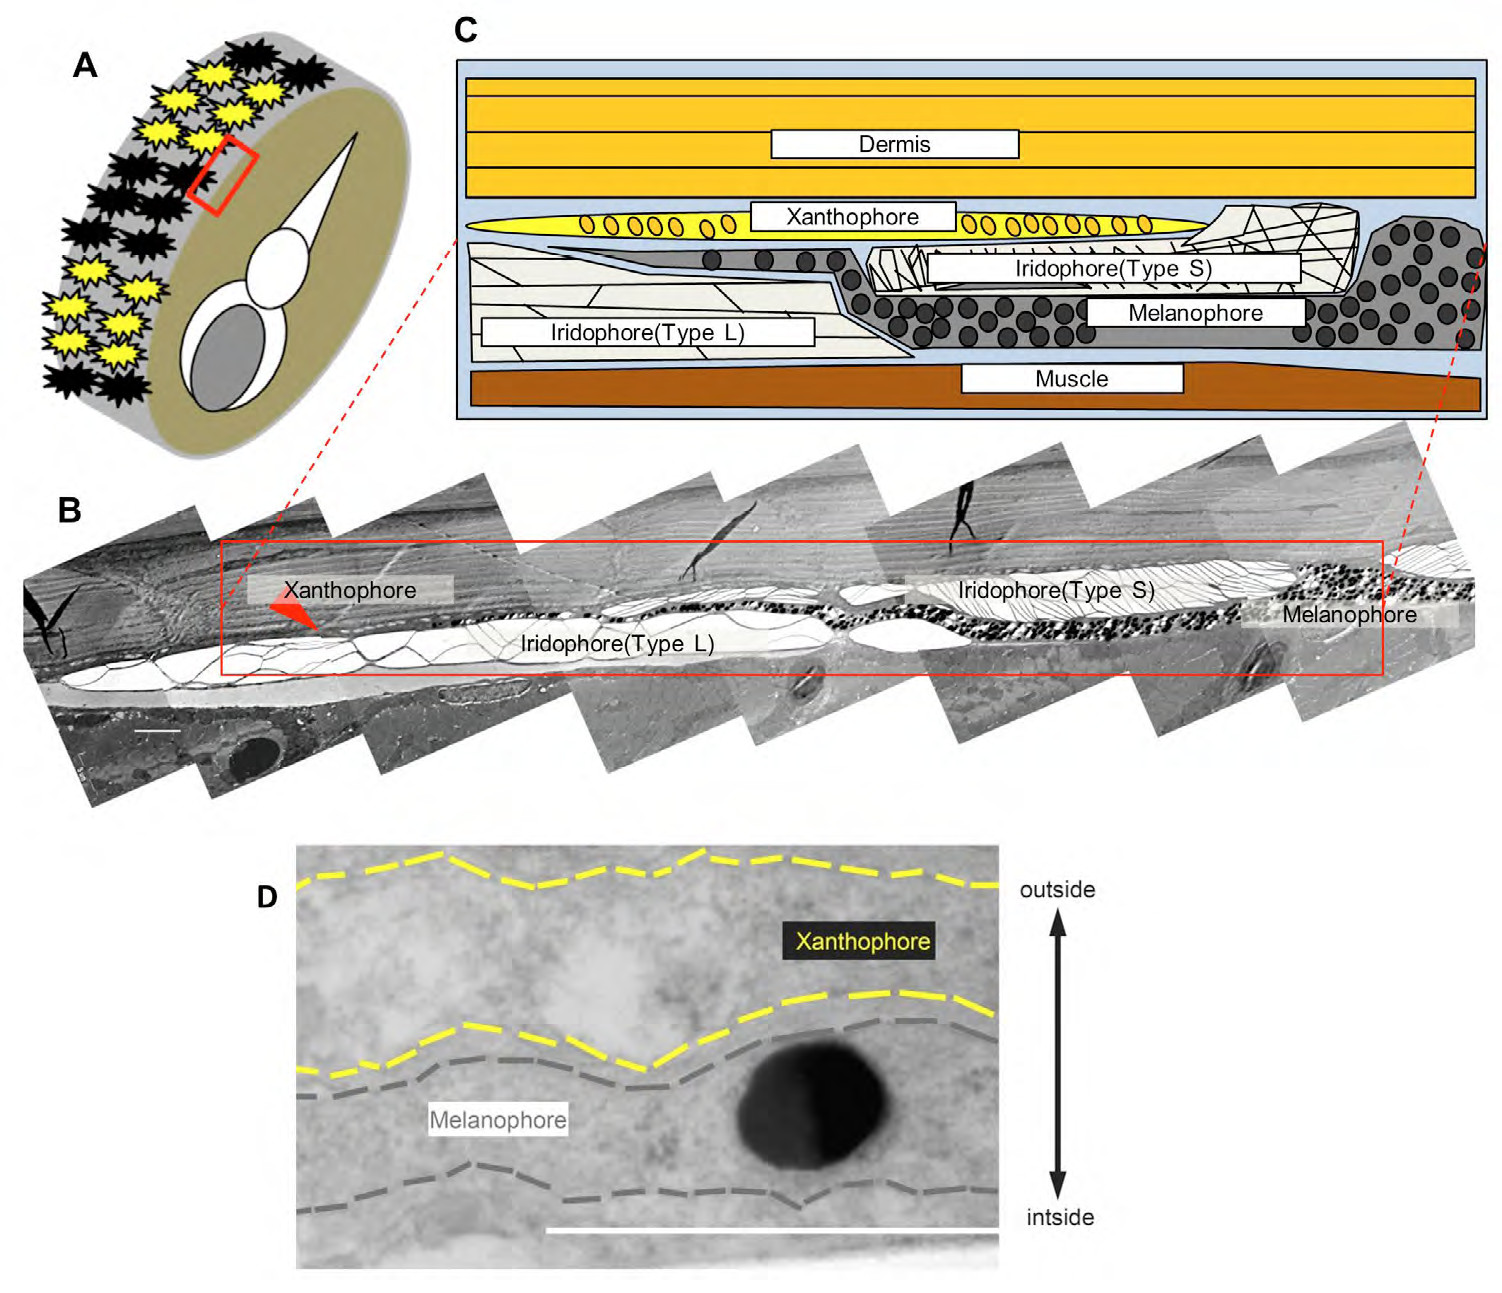
Fig. S6
Electron microscopy of zebrafish skin showing the direct contact between melanophores and xanthophores. (A) Region of the skin examined by transmission electron microscopy (red square). (B) Low magnification image showing different pigment cell classes. (C) Schematic rendering of boxed region in (B). (D) Magnified image of melanophore projection tip in other sample. In the previous report of electron microscopy analysis, we showed that melanophores and xanthophores are generally separated by the insertion of iridophores (Hirata et al., 2003). We found, however, that melanophore membrane (black dashed line) and xanthophore membrane (yellow dashed line) were close proximity to one another at the stripe boundary. Scale bar = 5μm in B, 1μm in D.