
|
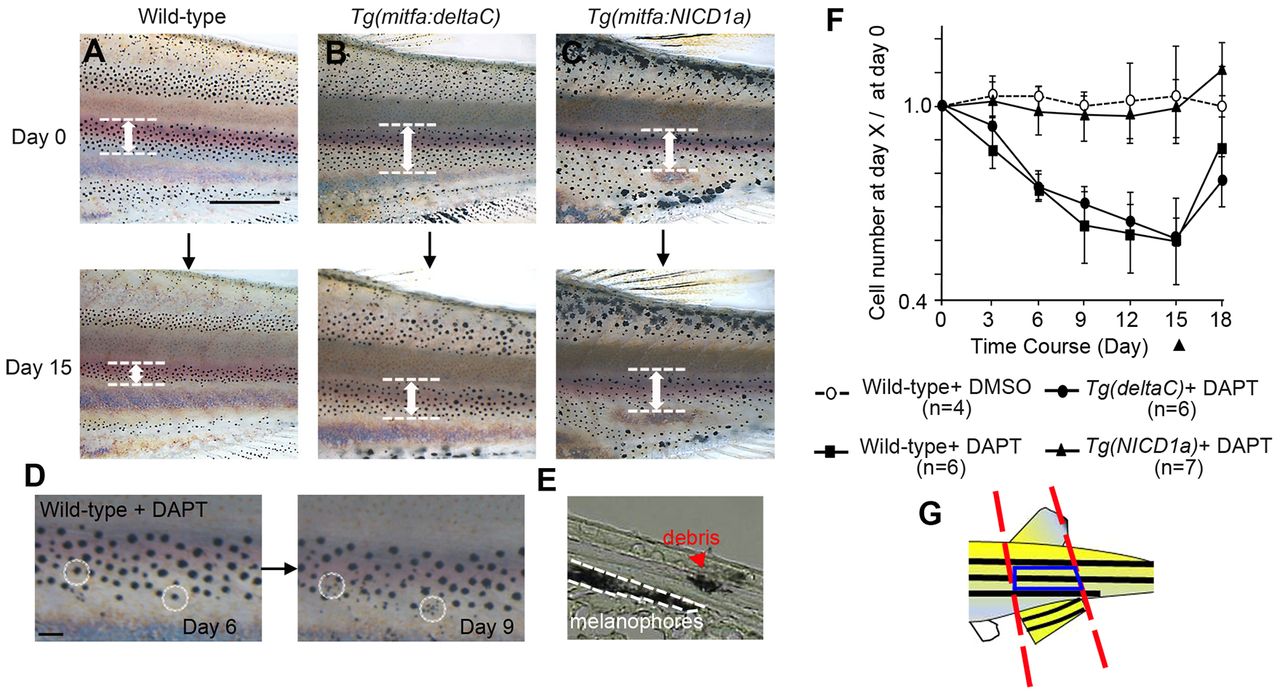
Fig. 2
Effect of Notch inhibitor on melanophores. (A-C) Altered melanophore distributions resulting from DAPT treatment over 15 days. Width of black stripes (white arrows) became narrowed in wild-type and Tg(mitfa:deltaC) fish, but remained unchanged in Tg(mitfa:NICD1a) fish. (D) Death of melanophores. Two cells (circled by dotted lines) present at day 6 (left) were lost by day 9 (right), though residual melanin-containing debris remains visible. (E) Cross-section through the skin of a DAPT-treated fish. A remaining melanophore is in the lowest layer of the skin (bounded by white dashed line). Melanin-containing debris from a dead cell was observed (red arrowhead) more superficially in the dermis. (F) Alteration of melanophore numbers (mean ± s.d.) during DAPT treatment, shown as the ratio of cells surviving at day X relative to the total number of cells at day 0. DAPT was applied at day 0 and removed at day 15 (black arrowhead). (G) Blue box shows the region in which melanophores were counted for analyses shown in F, defined as the middle stripe, delimited by anterior and posterior margins of the caudal and dorsal fins. Scale bars: 1 mm (A-C); 100 μm (D).