
- Title
-
miR-34b regulates multiciliogenesis during organ formation in zebrafish
- Authors
- Wang, L., Fu, C., Fan, H., Du, T., Dong, M., Chen, Y., Jin, Y., Zhou, Y., Deng, M., Gu, A., Jing, Q., Liu, T., and Zhou, Y.
- Source
- Full text @ Development
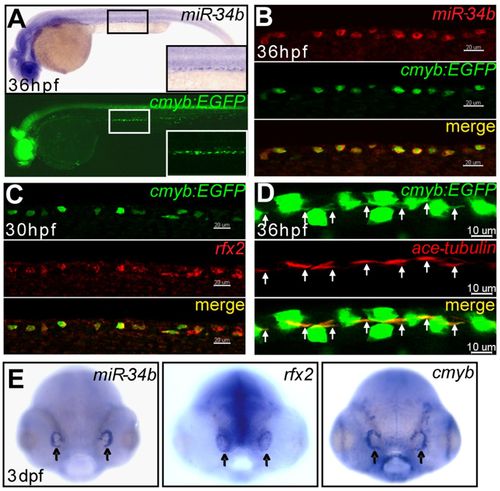
miR-34b expression is enriched in kidney MCCs and in the olfactory placode. (A) Lateral view of a 36-hpf zebrafish embryo after in situ hybridization shows that the expression of miR-34b resembles the pattern of kidney cells labeled by Tg(cmyb:EGFP). A magnified lateral view (inset) shows the labeled cells distributed in a punctate pattern. (B,C) Confocal images (lateral view) of the kidney region show the colocalization of miR-34b, rfx2 (red, WISH) and Cmyb:EGFP (green, immunostaining). (D) Confocal images of the kidney region show that each Cmyb:EGFP+ cell (green, immunostaining; overexposed to show the cilia bundle region, arrows) has a cilia bundle (immunolabeled using anti-acetylated tubulin antibody, red, arrows). The GFP staining is weaker in B and C than in D owing to the different staining methods. (E) Dorsal view of a 3-dpf embryo after in situ hybridization shows expression of miR-34b, rfx2 and cmyb in the olfactory placode (arrows). Scale bars: 20 μm in B,C; 10 μm in D. EXPRESSION / LABELING:
|

Loss of miR-34b disrupts kidney morphogenesis. (A-F) In situ hybridization with the rfx2 probe and images of the Tg(cmyb:EGFP) embryo show that MCCs accumulate in the middle part of the pronephric duct (arrows) in miR-34b morphants at 3 dpf. C and F show the percentage of embryos with abnormal cmyb+ (shown in A,B) or rfx2+ (shown in D,E) MCCs. Embryos with accumulated MCCs (Accumulated) or higher expression levels of cmyb or rfx2 (Higher expression) were counted. (G-I) A magnified lateral view (with a small angle to dorsal) of a 3-dpf embryo after in situ hybridization with the pax2 probe shows that proximal tubule convolution is blocked at 3 dpf in miR-34b morphants. Examples of normal proximal tubule convolution (G) and of mild and severe defects (H) are illustrated in the insets. The angle between the kidney duct and tubule (DT angle) was measured. Each circle/triangle in I represents an embryo. Mean ± s.d. ***P<0.0001 (unpaired t-test). (J-L) Lateral view of a 3-dpf embryo after in situ hybridization with the trpm7 probe shows that transporting epithelial cells accumulate in the middle region (bracket) of the pronephric duct 3 dpf after miR-34b knockdown. L shows the percentage of embryos with abnormal distribution of trpm7+ transporting epithelial cells (Defective). (M,N) Hematoxylin and Eosin (H&E) staining on a transverse section (plane indicated by the white line in A) shows the enlarged tubule diameter (outlined) after miR-34b knockdown. EXPRESSION / LABELING:
PHENOTYPE:
|
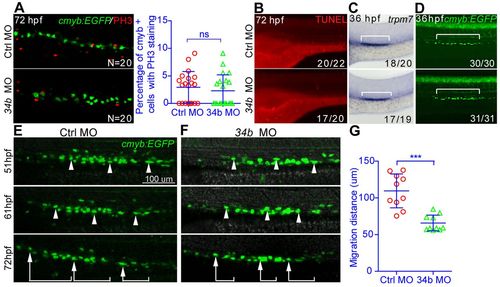
MCC accumulation is mainly caused by attenuated cell migration. (A) A magnified lateral view of the kidney region after double staining of cmyb:EGFP and PH3 in 3-dpf embryos. (B) A magnified lateral view of the kidney region after TUNEL staining in 3-dpf embryos. (C,D) Distribution of transporting epithelial cells (bracket) (C) and MCCs (D) labeled by trpm7 (WISH) and Tg(cmyb:EGFP) at 36 hpf. (B-D) The number of embryos with normal TUNEL staining, trpm7 expression pattern or cmyb expression pattern among all analyzed embryos is indicated (bottom right). (E-G) The migration of MCCs labeled by Tg(cmyb:EGFP) from 51 to 72 hpf. Three representative MCCs were labeled (arrowheads and brackets) in embryos injected with either control (Ctrl) MO (E) or miR-34b MO (F). The migration distance of each MCC is shown in G (each circle/triangle represents an MCC, n=10). Mean ± s.d. ***P<0.0001 (unpaired t-test); ns, not significant. Scale bar: 100 μm. EXPRESSION / LABELING:
PHENOTYPE:
|
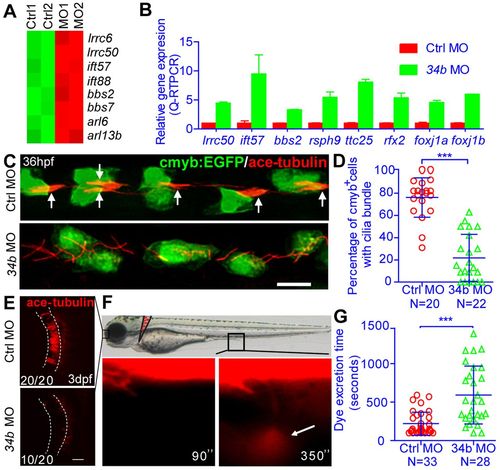
miR-34b regulates kidney morphogenesis by controlling multiciliogenesis and fluid flow. (A) Heat map showing the expression of genes in the GO term Cilium Assembly. The color scale represents the expression level of a gene above (red) or below (green) the mean expression level across all samples. (B) QRT-PCR analysis of the expression of cilia genes in MCCs that were isolated from 3-dpf Tg(cmyb:EGFP) embryos by flow cytometry. The expression levels were normalized to that of β-actin 1. (C) The ciliary (anti-acetylated tubulin staining, red, arrows) morphology of the MCCs (anti-GFP staining, green) at 36 hpf in normal embryos and miR-34b morphants. Arrows indicate normal cilia bundles. (D) The percentage of cmyb:EGFP+ cells with cilia bundles was calculated for each embryo and analyzed statistically at 36 hpf. (E) The ciliary morphology of the olfactory placode (outlined) at 3 dpf in normal embryos and miR-34b morphants. The number of embryos with normal cilia (top picture) or shorter cilia (bottom picture) among all analyzed embryos is indicated (bottom left). (F) Representative example of the dye excretion assay (3.5-dpf normal embryo), in which the time from injection until the first visible urine excretion at the cloaca (arrow) is measured. (G) Statistical analysis of the time from injection to dye excretion. Each circle/triangle represents an embryo. Mean ± s.d. ***P<0.0001 (unpaired t-test). Scale bar: 10 μm. EXPRESSION / LABELING:
PHENOTYPE:
|
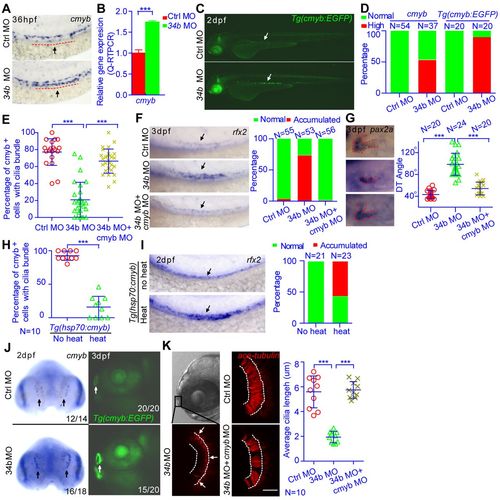
miR-34b regulates multiciliogenesis and kidney morphogenesis through cmyb. (A) WISH analysis of cmyb expression at 36 hpf. The arrow and dashed line show the region of MCCs. (B) QRT-PCR analysis of cmyb expression in MCCs that were isolated from 3-dpf Tg(cmyb:EGFP) embryos by flow cytometry. The expression level was normalized to that of β-actin 1. (C) A 2-dpf Tg(cmyb:EGFP) embryo shows enhanced fluorescence in MCCs (arrow) after miR-34b knockdown. (D) Statistical analysis of A and C showing normal versus high expression of cmyb. (E) The percentage of cmyb:EGFP+ cells with cilia bundles was calculated for each embryo and analyzed statistically at 36 hpf. (F,G) A magnified lateral view of 3-dpf embryos after in situ hybridization with rfx2 or pax2 probe shows the distribution of MCCs and the state of proximal tubule convolution. Arrows (F) indicate rfx2+ MCCs. The DT angle was measured. (H) The percentage of cmyb:EGFP+ cells with cilia bundles was calculated for each Tg(hsp70:cmyb) embryo and analyzed statistically at 36 hpf (I) A magnified lateral view of 2-dpf Tg(hsp70:cmyb) embryos after in situ hybridization with rfx2 probe shows the distribution of MCCs. Arrows indicate rfx2+ MCCs. The percentage of embryos with accumulated rfx2+ MCCs (Accumulated) in F and I was calculated. (J) WISH analysis of cmyb expression at 2 dpf in the olfactory placode (arrows). A representative image of a 3-dpf Tg(cmyb:EGFP) embryo shows enhanced fluorescence of the olfactory placode (arrows) after miR-34b knockdown. The number of embryos with normal (top pictures) or high expression level (bottom pictures) of cmyb among all analyzed embryos is indicated (bottom right). (K) The ciliary (anti-acetylated-tubulin staining, red) morphology of the olfactory placode at 3 dpf in normal embryos, miR-34b morphants and embryos injected with both miR-34b MO and cmyb MO. Cilia length was analyzed at three positions (arrows) for each embryo, and the average cilia length is listed. Each circle/triangle/cross represents an embryo. Mean ± s.d. ***P<0.0001 (unpaired t-test). Scale bar: 10 μm. EXPRESSION / LABELING:
PHENOTYPE:
|
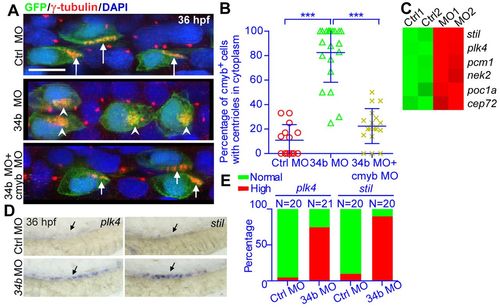
The miR-34b-cmyb genetic pathway regulates the multiplication and membrane docking of centrioles. (A) The centriole (anti-γ-tubulin staining, red, arrows) morphology of MCCs (anti-GFP staining, green) in normal embryos, miR-34b morphants and embryos injected with both miR-34b MO and cmyb MO. Arrows indicate centrioles on the cell surface; arrowheads indicate centrioles in the cytoplasm. (B) Statistical analysis of A. Each circle/triangle/cross represents an embryo. Mean ± s.d. ***P<0.0001 (unpaired t-test). (C) Heat map showing the expression of genes related to centriole duplication from the microarray data of 3-dpf MCCs. The color scale represents the expression level of a gene above (red) or below (green) the mean expression level across all samples. (D) WISH analysis of plk4 and stil expression at 36 hpf. The arrow identifies the appropriate MCC region. (E) Statistical analysis of D showing normal versus high expression of plk4 and stil. |
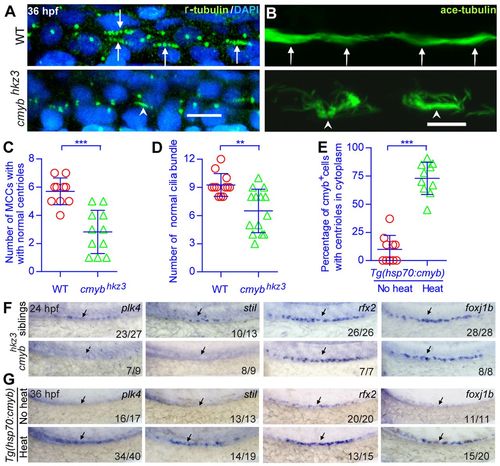
cmyb regulates the expression of key regulatory genes involved in centriole duplication and ciliogenesis. (A-D) Morphological and statistical analysis of the centriole (anti-γ-tubulin staining, green in A) and cilia bundle (anti-acetylated tubulin staining, green in B) in the middle kidney duct of wild-type and cmyb mutant embryos. Membrane RFP was injected and stained to help identify the cell boundaries (data not shown). Arrows indicate normal centrioles and ciliar bundles; arrowheads indicate defective centrioles and cilia bundles. (E) The percentage of cmyb:EGFP+ cells with cilia bundles was calculated for each Tg(hsp70:cmyb) embryo and analyzed statistically at 36 hpf. (C-E) Each circle/triangle represents an embryo. Mean ± s.d. **P<0.01, ***P<0.0001 (unpaired t-test). (F,G) WISH analysis of plk4, stil, rfx2 and foxj1b expression in normal embryos, cmyb mutants and embryos overexpressing cmyb. Arrows indicate the regions where MCCs are located. The number of embryos with normal (top pictures in F,G), low (bottom pictures in F) or high expression levels (bottom pictures in G) of a tested gene among all analyzed embryos is indicated (bottom right). WT, wild type. Scale bars: 10 μm. |
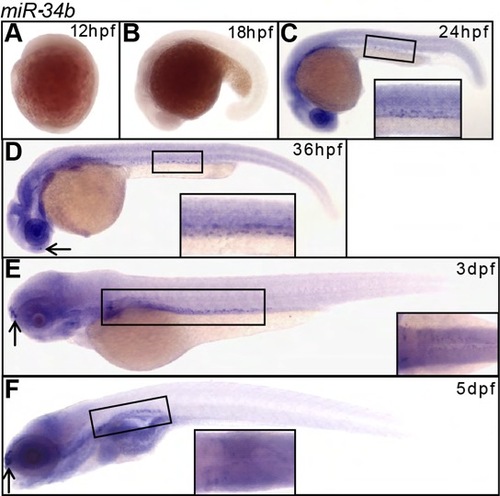
Expression pattern of miR-34b (WISH) during development. (A-F) Expression of miR-34b is first observed at 24 hpf (C) at the kidney region and persists until at least 5 dpf (F). Magnified lateral view with a small angle to dorsal shows that the labeled cells reside in both pronephric ducts (C,D, insets). Magnified dorsal view (E,F) of the kidney region is shown in the inset. Olfactory placode is indicated by arrows. |
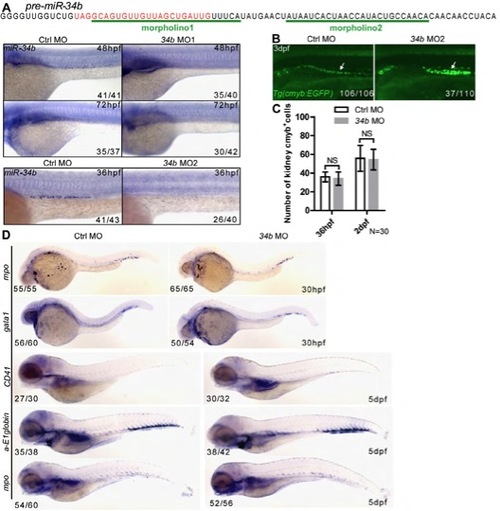
Successful knockdown of miR-34b by morpholinos. (A) Two morpholinos were designed and shown to block the biogenesis of mature miR-34b (WISH). (B) Image of Tg(cmyb:EGFP) embryo shows that MCCs accumulate in the middle part of pronephric duct at 3 dpf after miR-34b MO2 injection. (C) Manual count of MCCs labeled by Tg(cmyb:EGFP) at 36 and 48 hpf. n=30 for Ctrl MO and miR-34b MO (mean ± s.d.). (D) Representative results show hematopoiesis after miR-34b knockdown. |
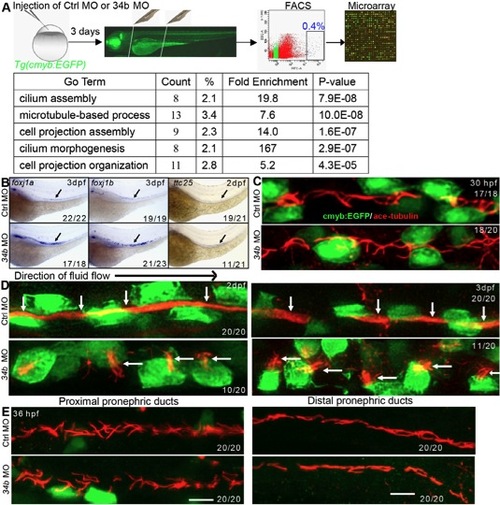
Analysis of MCC gene expression profile and multiciliogenesis. (A) Work flow of microarray analysis. (B) Expression analysis of upregulated ciliary genes in the microarray data by WISH. (C,D) The ciliary morphology (anti-acetylated tubulin staining, red, arrows) of MCCs (anti-GFP staining, green) at 30 hpf (C), 2 dpf and 3 dpf (D) in normal embryos and miR-34b morphants. (E) The ciliary morphology (red) at proximal and distal pronephric ducts of 36-hpf normal embryos and miR-34b morphants. |