
IMAGE
Fig. S3
- ID
- ZDB-IMAGE-130801-25
- Publication
- Wang et al., 2013 - miR-34b regulates multiciliogenesis during organ formation in zebrafish
- All Figures
- Figures for Wang et al., 2013
Image
|
Figure Caption
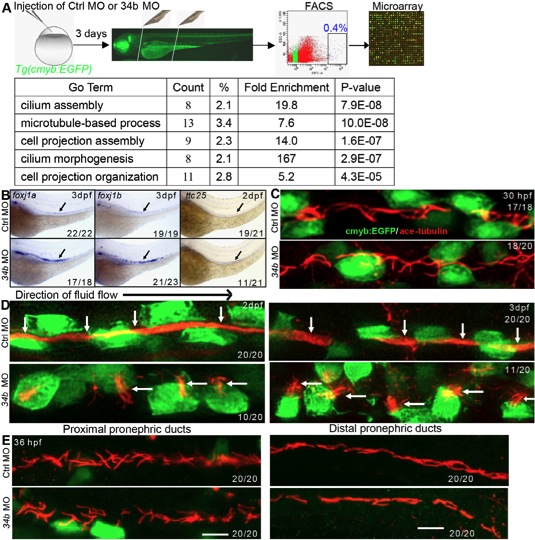
Fig. S3 Analysis of MCC gene expression profile and multiciliogenesis. (A) Work flow of microarray analysis. (B) Expression analysis of upregulated ciliary genes in the microarray data by WISH. (C,D) The ciliary morphology (anti-acetylated tubulin staining, red, arrows) of MCCs (anti-GFP staining, green) at 30 hpf (C), 2 dpf and 3 dpf (D) in normal embryos and miR-34b morphants. (E) The ciliary morphology (red) at proximal and distal pronephric ducts of 36-hpf normal embryos and miR-34b morphants.
Acknowledgments
This image is the copyrighted work of the attributed author or publisher, and
ZFIN has permission only to display this image to its users.
Additional permissions should be obtained from the applicable author or publisher of the image.
Full text @ Development