
Fig. 3
- ID
- ZDB-IMAGE-130801-30
- Genes
- Publication
- Wang et al., 2013 - miR-34b regulates multiciliogenesis during organ formation in zebrafish
- All Figures
- Figures for Wang et al., 2013
|
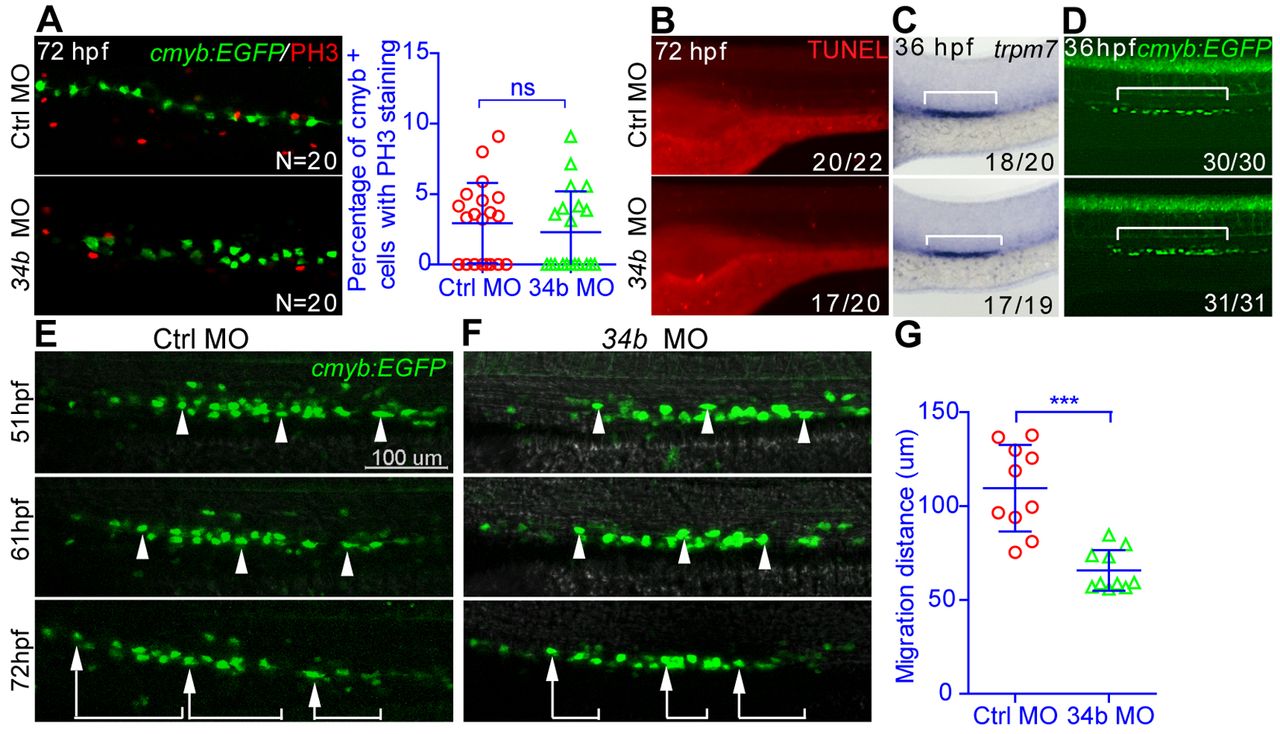
Fig. 3 MCC accumulation is mainly caused by attenuated cell migration. (A) A magnified lateral view of the kidney region after double staining of cmyb:EGFP and PH3 in 3-dpf embryos. (B) A magnified lateral view of the kidney region after TUNEL staining in 3-dpf embryos. (C,D) Distribution of transporting epithelial cells (bracket) (C) and MCCs (D) labeled by trpm7 (WISH) and Tg(cmyb:EGFP) at 36 hpf. (B-D) The number of embryos with normal TUNEL staining, trpm7 expression pattern or cmyb expression pattern among all analyzed embryos is indicated (bottom right). (E-G) The migration of MCCs labeled by Tg(cmyb:EGFP) from 51 to 72 hpf. Three representative MCCs were labeled (arrowheads and brackets) in embryos injected with either control (Ctrl) MO (E) or miR-34b MO (F). The migration distance of each MCC is shown in G (each circle/triangle represents an MCC, n=10). Mean ± s.d. ***P<0.0001 (unpaired t-test); ns, not significant. Scale bar: 100 μm.