- Title
-
Proteoglycan-mediated axon degeneration corrects pretarget topographic sorting errors
- Authors
- Poulain, F.E., and Chien, C.B.
- Source
- Full text @ Neuron
|
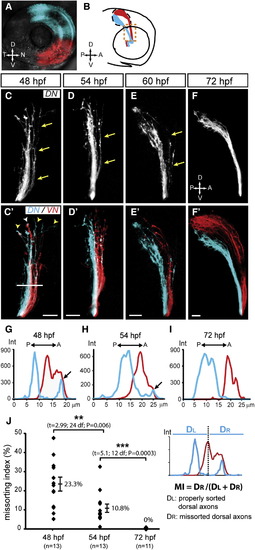
Sorting of Retinal Axons in the Optic Tract Is Achieved through a Correction Mechanism (A) DiD (blue) and DiI (red) were topographically injected into the DN and VN quadrants of the retina, respectively. Lateral view, confocal maximal projection. (B) Diagram of corresponding DN (blue) and VN (red) retinal projections observed at 72 hpf in a lateral view after removing the contralateral eye. The optic tract region is demarcated with orange dashed line. (C–F′) Dorsal axon trajectories are progressively corrected between 48 and 72 hpf. At 48 hpf, DN (C, blue in C′) and VN (red in C2) axons are not precisely sorted in the optic tract. Some DN axons (arrows) are observed along VN axons in the most anterior/dorsal part of the tract. DN (yellow arrowheads in C′) and VN (white arrowhead) growth cones leading axons are intermingled. At 54 hpf (D and D′) and 60 hpf (E and E′), some DN axons are still missorted along VN axons (arrows). This missorting is no longer observed at 72 hpf (F and F′). Lateral views, confocal maximal projections; scale bar represents 20 μm. See also Figure S1. (G–I) Representative examples showing measurement of axon sorting in the tract at 48 hpf (G), 54 hpf (H), and 72 hpf (I). Intensity (Int, y axis) of DiD (blue) and DiI (red) signals was measured along a reference line drawn perpendicular to the tract (as indicated in C′). DiD signals are observed anteriorly to DiI signals at 48 and 54 hpf (arrows), but not at 72 hpf. (J) Quantification of missorting: a missorting index (MI) was calculated as the ratio of the signal intensity corresponding to missorted DN axons (DR) to the signal intensity of all DN axons (DL + DR). DN axons were considered missorted when located anterior to the VN axons with the highest signal intensity. Missorting of DN axons is evident at 48 hpf and becomes progressively corrected by 72 hpf. Error bars correspond to SEs. p < 0.05, p < 0.001. |
|
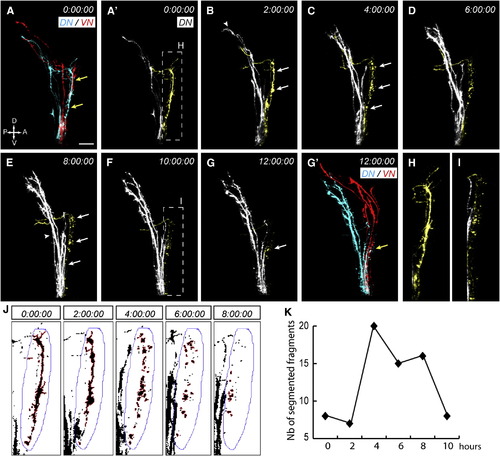
Missorted Dorsal Axons Selectively Degenerate (A–G′) DN (blue, DiD) and VN (red, DiO) axons were topographically labeled at 48 hpf and time-lapse imaged at 15 min intervals for 12 hr starting at 54 hpf. The organization of DN and VN axons is shown at the beginning (A) and the end (G′) of the time-lapse, while time series of confocal image stack projections (A′–G) show DN axons only. Missorted DN axons are pseudocolored in yellow for the best visualization. Times indicate hours. Some DN axons are clearly missorted at 54 hpf (A′) and have a normal morphology (H). After 2 hr (B), correctly sorted axons have reached the tectum (arrowhead), while missorted DN axons stop their growth and start blebbing (arrows). They then fragment uniformly along their length over time (C–G, arrows), while correctly sorted axons (arrowhead in E) continue to grow toward the tectum. Fragments appear smaller at later stages (F, zoomed picture in I) and become hard to detect after 12 hr (G). Scale bar represents 20 μm. (See also Movies S1 and S2). (J) Maximal intensity projections of DiD signals at 0, 2, 4, 6, 8, and 10 hr (data not shown) were converted to binary images and a region of interest (ROI, blue line) surrounding missorted DN axons was defined. Axon segments within this region were then selected and analyzed using the “Analyze Particles” option in ImageJ. (K) Quantification of the number of axon fragments over time. Between 0 and 2 hr, the number of fragments is low, indicating that missorted axons are segmented as one main continuous region. The number of fragments then increases abruptly between 2 and 4 hr as axons degenerate and fragment. It then gradually decreases between 4 and 10 hr as axon fragments are progressively cleared. See also Figures S2 and S3. |
|
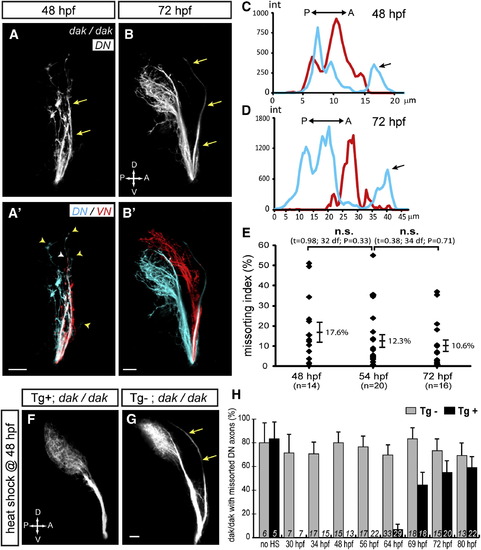
HS Is Required for Correcting Missorted DN Axons in the Tract(A–B2) DN (A and B, blue in A2 and B2) and VN (red in A′ and B′) retinal axons were topographically labeled at 48 and 72 hpf in dak mutants lacking HS. As observed in WT (Figure 1), some missorted DN axons are observed along VN axons at 48 hpf (arrows). DN (yellow arrowheads) and VN (white arrowhead) growth cones navigate along mixed trajectories (A′). In contrast to WT, however, missorted DN axons remain clearly visible at 72 hpf (arrows). Lateral views, confocal maximal projections; scale bar represents 20 μm. (C and D) Measurement of DiD and DiI signal intensities across the tract shows that missorted DN axons remain from 48 to 72 hpf in dak. (E) Missorting index (MI) is similar at 48, 54, and 72 hpf in dak, showing that missorted DN axons are not corrected. Error bars correspond to SEs. (F–H) Restoring HS synthesis at late stages in dak mutants corrects missorted DN axons. (F and G) Tg(hsp70l:ext2-2A-TagRFP); dak mutant embryos were heat shocked at 39°C for 1 hr at 48 hpf, fixed at 4 dpf, and their DN axons were topographically labeled with DiO. dak mutants carrying the rescue ext2 transgene (Tg+, F) do not show any missorted DN axons, whereas dak sibling mutants lacking the transgene (Tg, G) do (arrows). Lateral views, confocal maximal projections; scale bar represents 20 μm. (H) The proportion of dak mutants with missorted DN axons was scored at 4 dpf after embryos were heat shocked at various stages. In absence of heat shock, around 80% of dak mutants exhibit missorted DN axons. Heat shocks as late as 64 hpf correct missorting of DN axons in Tg+ but not in Tg dak mutants. Error bars correspond to SEs. |
|
HS Is Required Non-Cell-Autonomously for Correct Sorting of DN Axons (A) DN RGCs from an isl2b:TagRFP donor embryo were topographically transplanted between 30 and 34 hpf into the DN retina of an isl2b:EGFP host embryo. EGFP is shown in blue in the figure for the best visualization. (B–F′) Diagrams (B) and pictures (C–F′) of corresponding DN donor axons observed at 4 dpf. Lateral views, confocal maximal projections. In WT > WT (C and C′) and dak > WT (E and E′) transplants, DN donor axons (TagRFP+) pass through the ventral branch of the optic tract. In contrast, in dak > dak (D and D′) and WT > dak (F and F′) transplants, some donor axons are missorted along the dorsal branch of the tract (arrows) before reaching the tectum. Insets show transplanted DN TagRFP+ RGCs localized in the DN part of the host retina. (G) Quantification of missorting in transplants. The proportion of hosts with missorted donor DN axons was scored at 4 dpf. Missorting is observed in dak mutants but not WT hosts, indicating that HS is required non-cell-autonomously for correct sorting of retinal axons. Error bars correspond to SEs. |
|
Some ON axons are missorted at early stages of development(related to Figure I). |
|
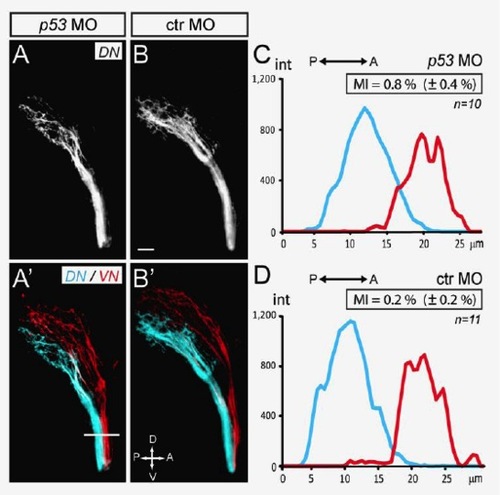
Missorted DN axons are corrected in absence of p53 (related to Figure 2). |
|
Neuronal activity in RGCs is not required for correction of missorted ON axons (related to Figure 2). |

