
- Title
-
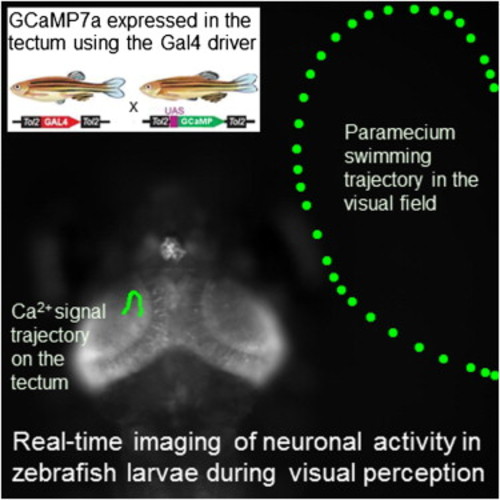
Real-Time Visualization of Neuronal Activity during Perception
- Authors
- Muto, A., Ohkura, M., Abe, G., Nakai, J., and Kawakami, K.
- Source
- Full text @ Curr. Biol.
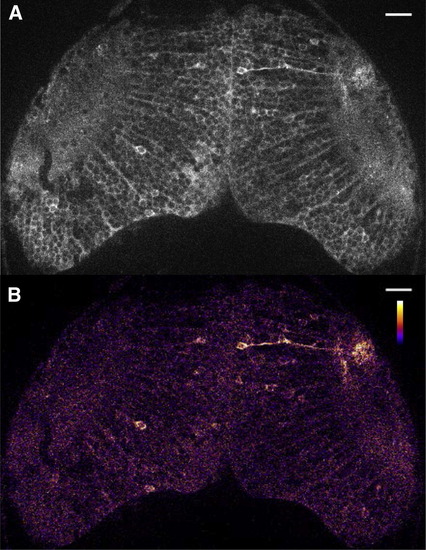
Spontaneous Neuronal Activity in the Optic Tectum in a Zebrafish Larva(A) UAS:GCaMP7a fish were mated to gSA2AzGFF49A fish that expressed Gal4FF in the tectum. A double-transgenic larva at 3 dpf was embedded in agarose and imaged with a confocal microscope. A single raw image of the fluorescence intensity extracted from a time-lapse movie is shown (see Movie S1).(B) The ratiometric image of (A) was created and pseudocolored to reveal the fluorescence change in the cell body and axon neurite of a single neuron.Scale bars represent 20 μm. EXPRESSION / LABELING:
|
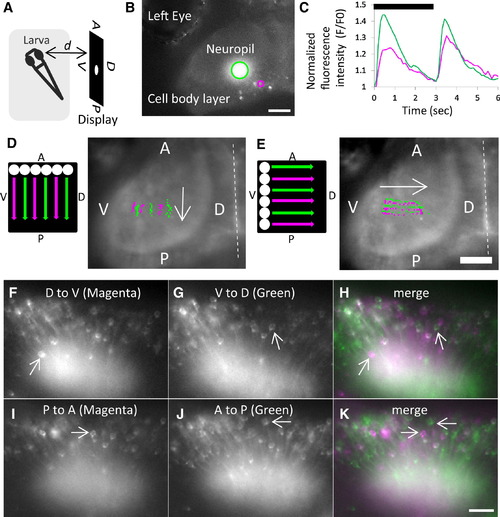
Tectal Responses to Visual Stimuli (A) The recording setup, with the directions of the spot stimulus indicated on a display: A, anterior; P, posterior; D, dorsal; V, ventral. d, distance.(B and C) ON and OFF responses in the optic tectum of a 6 days postfertilization (dpf) larva.(B) Ca2+ signals detected in the neuropil (green) and cell body (magenta). Scale bar represents 50 μm.(C) Normalized fluorescence intensity (F/F0) in the neuropil (green) and cell body (magenta) was increased 0.4–0.5 s after ON and OFF of a spot on the display (Movie S2). The black bar indicates duration (3 s) of appearance (ON) of a spot. d = 15 mm.(D and E) Visuotopic responses in the neuropil of a 7 dpf larva. A spot was moved along the display in the A-to-P (D) and V-to-D (E) directions at a speed of 13.4 mm/s for 1.6 s to create six tracks in parallel. The tracks are colored in magenta and green alternately. The area of Ca2+ signals on the neuropil in each frame (10 frames/s) was defined by setting the threshold manually, and the center of mass was plotted and colored in accordance with the color of the track. The Ca2+ signals moved in the A-to-P (D) and V-to-D (E) directions (indicated by arrows), and their movements recapitulated six tracks on the neuropil. Dashed lines indicate the midline of the larva. Scale bar represents 50 μm. d = 20 mm.(F–K) Identification of direction-selective neurons in the optic tectum of a 5 dpf larva.(F and G) A spot was moved along the D-V axis of the display to create six tracks (with a width of 21.45 mm) in the D-to-V (F) or V-to-D (G) directions.(I and J) A spot was moved along the A-P axis of the display to create four tracks (with a width of 14.3 mm) in the P-to-A (I) and A-to-P (J) directions. Cells responding to D-to-V (F) and P-to-A (I) were colored in magenta, and cells responding to V-to-D (G) and A-to-P (J) were colored in green.(H and K) (F) and (I) were merged with (G) and (J), respectively, and direction-selective neurons were identified (arrows). Scale bar represents 25 μm. d = 15 mm. |
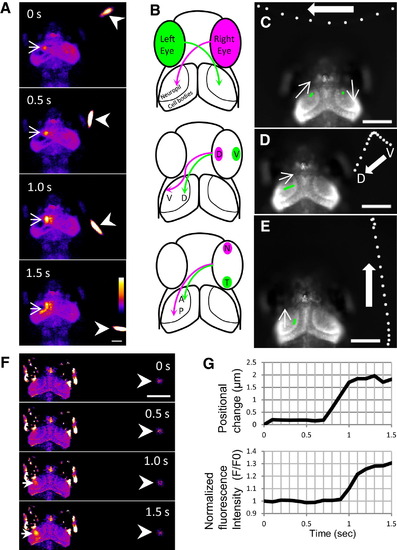
Tectal Responses during Perception of a Swimming Paramecium(A) In response to a swimming paramecium (arrowheads), Ca2+ transients (arrows) were detected in the neuropil and cell bodies of the left tectum of a 7 dpf larva embedded in agarose (Movie S3). Ratio images were created and pseudocolored. Scale bar represents 100 μm.(B) Retinotopic projections of the retinal ganglion cell axons: D, dorsal; V, ventral; N, nasal; T, temporal; A, anterior; P, posterior.(C–E) Functional visuotopy (Movie S3). White spots indicate the positions of a paramecium, moving in the indicated directions. Green spots indicate the positions of Ca2+ signals in the neuropil. Scale bars represent 100 μm.(C) A paramecium moved from the right to left hemifield, and the Ca2+ signal moved from the left to right tectum.(D) A paramecium and Ca2+ signals moved from ventral to dorsal.E) A paramecium and Ca2+ signals moved from posterior to anterior.(F and G) Ca2+ signals in the tectum of a 7 dpf larva evoked by motion of a paramecium (Movie S4).(F) Ratio images of Ca2+ signals (arrows) detected when a paramecium (arrowheads) started to move. Scale bar represents 250 μm.(G) Graph plots of Ca2+ signals and positional changes of the paramecium. The paramecium started to move at 0.7 s (upper graph), and the fluorescence change was detectable after 0.9 s (lower graph). EXPRESSION / LABELING:
|
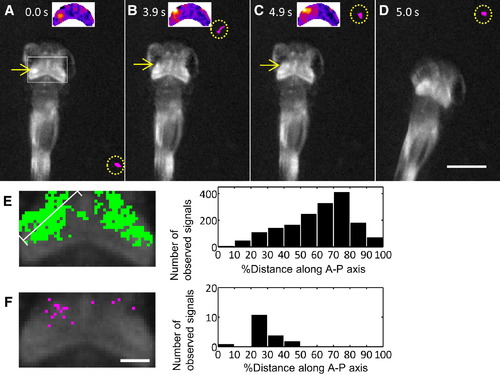
Tectal Responses of a 5 dpf Free-Swimming Larva during Perception of a Prey(A–D) Ca2+ signals in the tectum and prey capture behavior (Movie S5).(A–C) Ca2+ signals (arrows) were detected in the left tectum (arrows) when a paramecium moved from posterior to anterior on the right. Insets are pseudocolored ratio images.(C and D) The fish changed its direction and started approach swimming. The swimming paramecium is colored in magenta and encircled by dotted lines.(E) Left: positions of total Ca2+ signals observed on the tectal neuropil during the recording. Right: histogram of the Ca2+ signals’ relative distances along the anteroposterior axis of the tectum.(F) Left: positions of the Ca2+ signals observed in (C), one frame before the start of approach swimming. Right: histogram of the Ca2+ signals’ relative distances. Scale bar represents 100 μm. EXPRESSION / LABELING:
|
|
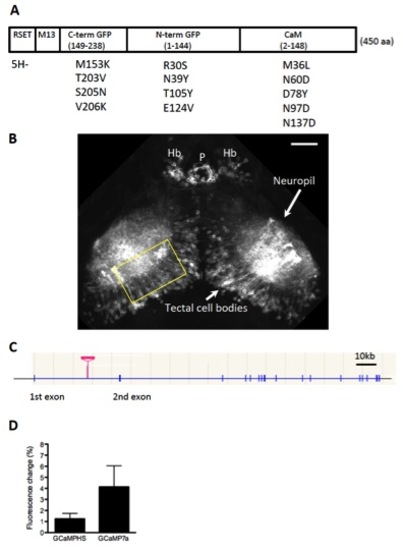
Expression of GCaMP7a in the Optic Tectum Using the Tectum-Gal4FF Driver Line, Related to Figure 1 (A) The structure of GCaMP7a. Thirteen amino acid substitutions were introduced to GCaMP-HS to generate GCaMP7a. The substitutions are indicated as the amino acid residue in GCaMP-HS (a single letter abbreviation), its position and the new amino acid residue. One amino acid was deleted in the RSET sequence (5H-). In the course of experiments, in addition to GCaMP7a, we tested five other GCaMP variants with amino acid changes in the EF hand motifs of calmodulin; namely, N60D, T26D/T28D/N60D, N60D/N97D/Y99D/S101D, T28D/N60D/N97D/S101D/N137D, and D24S/T28D/N97S/S101D/D133N/N137D; and found that GCaMP7a showed the best performance. RSET: a vector sequence; M13: a calmodulin binding peptide; C-term GFP: COOH-terminal half of EGFP; N-term GFP: NH2-terminal half of EGFP; CaM: calmodulin. (B) Gal4FF expression in the gSA2AzGFF49A transgenic line. Confocal image (a composite of z-series optical sections) of the tectal area in the gSA2AzGFF49A;UAS:membrane-tagged EGFP reporter (channelrhodopsin wide receiver-EGFP; ChRWR-EGFP)[2]. Cell bodies in the tectal neurons and their dendrites that extend into the neuropil area are visualized. Yellow rectangle shows areas shown in Fig. 1A-F. Hb: habenula, P: pineal body. Scale bar: 50 μm. (C) Integration site of the Gal4FF gene trap construct in the gSA2AzGFF49A fish. The Gal4FF gene trap construct was integrated within the first intron of the dlg2 gene on the chromosome 10. (D) Comparison of performance of GCaMPHS and GCaMP7a in vivo. UAS:GCaMPHS and UAS:GCaMP7a fish were crossed with a Gal4 driver gSA2AzGFF49A fish to generate double transgenic larvae. The fluorescence changes during spontaneous activation of the tectal neuropil area in the gSA2AzGFF49A;GCaMPHS (n = 18 calcium transients) larvae and in gSA2AzGFF49A;GCaMP7a larvae (n = 11 calcium transients) were averaged and shown as % change of the fluorescence intensity (mean +/-S.D.). |
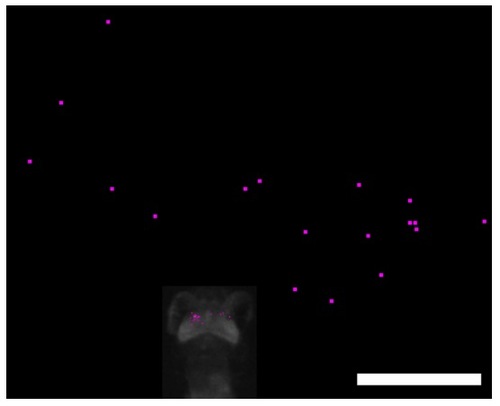
Calcium Imaging with a Free-Swimming Zebrafish Larvae during Perception of a Paramecium, Related to Figure 4 Positions of Ca2+ signals (small dots in the optic tectum of the larvae) and a swimming paramecium (large dots in the surrounding area) just before the start of approach swimming. Results were obtained from 18 recordings. Scale bar: 1000 μm. |