
|
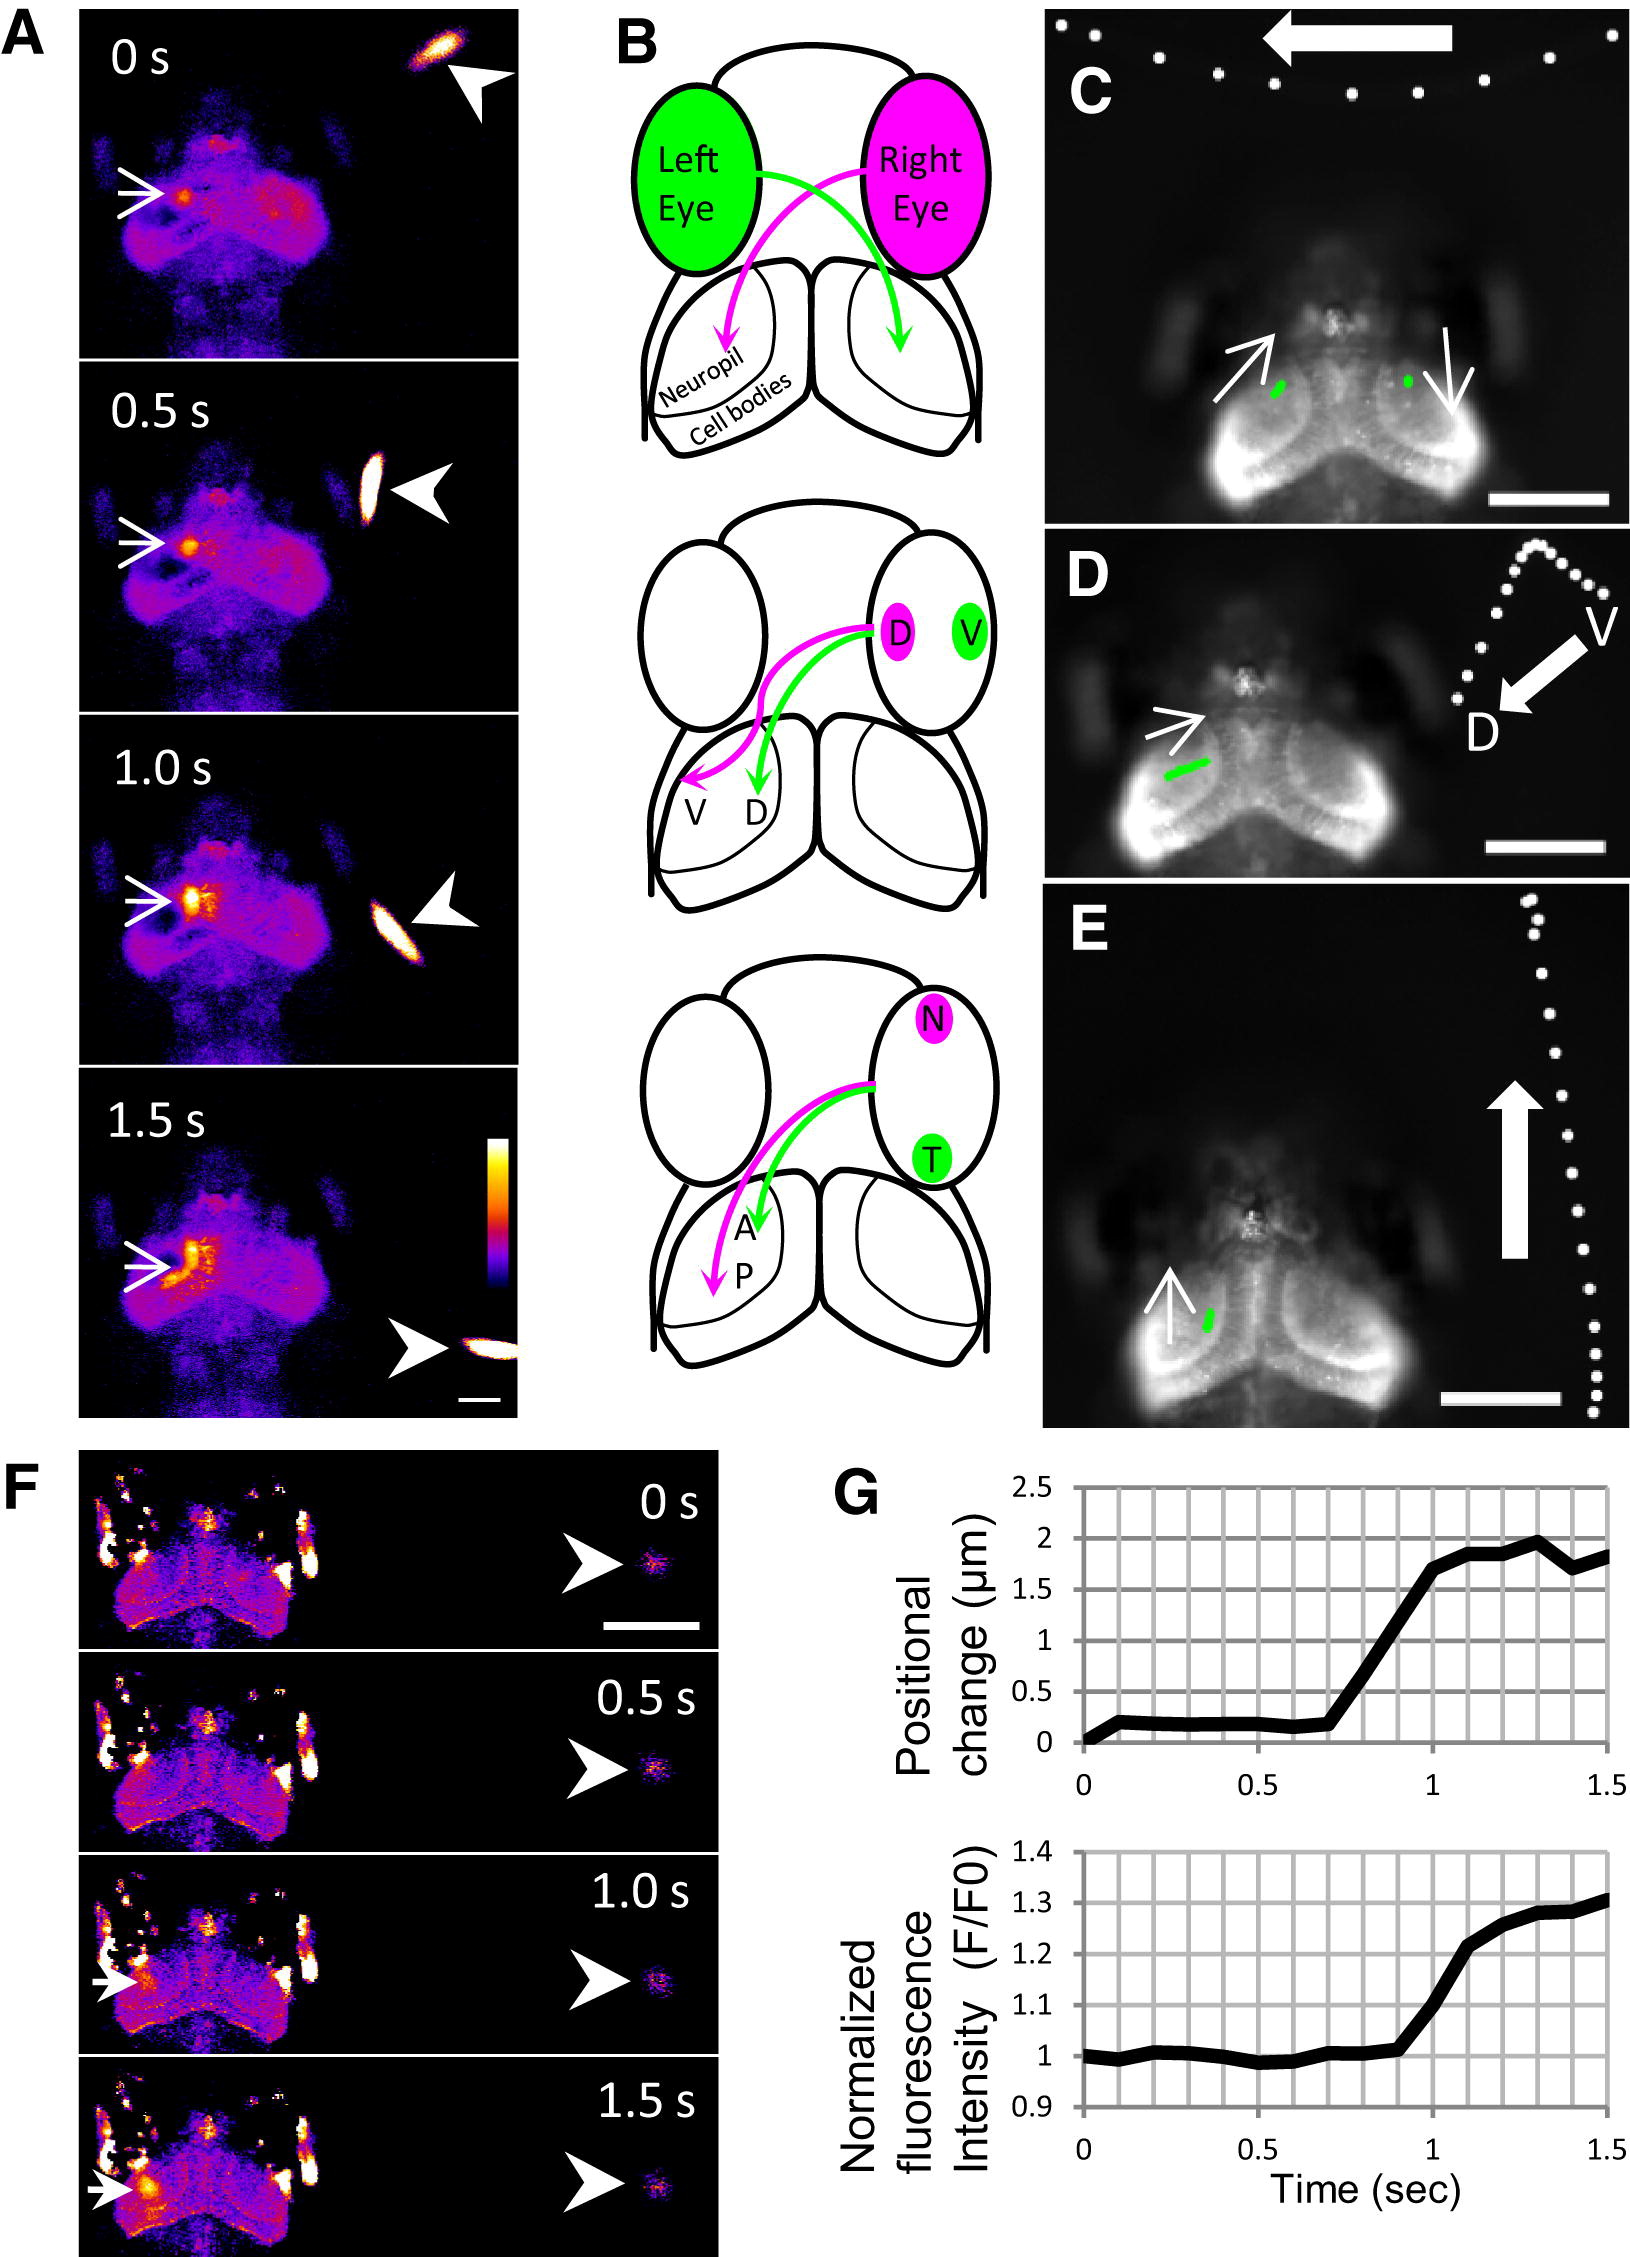
Fig. 3 Tectal Responses during Perception of a Swimming Paramecium(A) In response to a swimming paramecium (arrowheads), Ca2+ transients (arrows) were detected in the neuropil and cell bodies of the left tectum of a 7 dpf larva embedded in agarose (Movie S3). Ratio images were created and pseudocolored. Scale bar represents 100 μm.(B) Retinotopic projections of the retinal ganglion cell axons: D, dorsal; V, ventral; N, nasal; T, temporal; A, anterior; P, posterior.(C–E) Functional visuotopy (Movie S3). White spots indicate the positions of a paramecium, moving in the indicated directions. Green spots indicate the positions of Ca2+ signals in the neuropil. Scale bars represent 100 μm.(C) A paramecium moved from the right to left hemifield, and the Ca2+ signal moved from the left to right tectum.(D) A paramecium and Ca2+ signals moved from ventral to dorsal.E) A paramecium and Ca2+ signals moved from posterior to anterior.(F and G) Ca2+ signals in the tectum of a 7 dpf larva evoked by motion of a paramecium (Movie S4).(F) Ratio images of Ca2+ signals (arrows) detected when a paramecium (arrowheads) started to move. Scale bar represents 250 μm.(G) Graph plots of Ca2+ signals and positional changes of the paramecium. The paramecium started to move at 0.7 s (upper graph), and the fluorescence change was detectable after 0.9 s (lower graph).